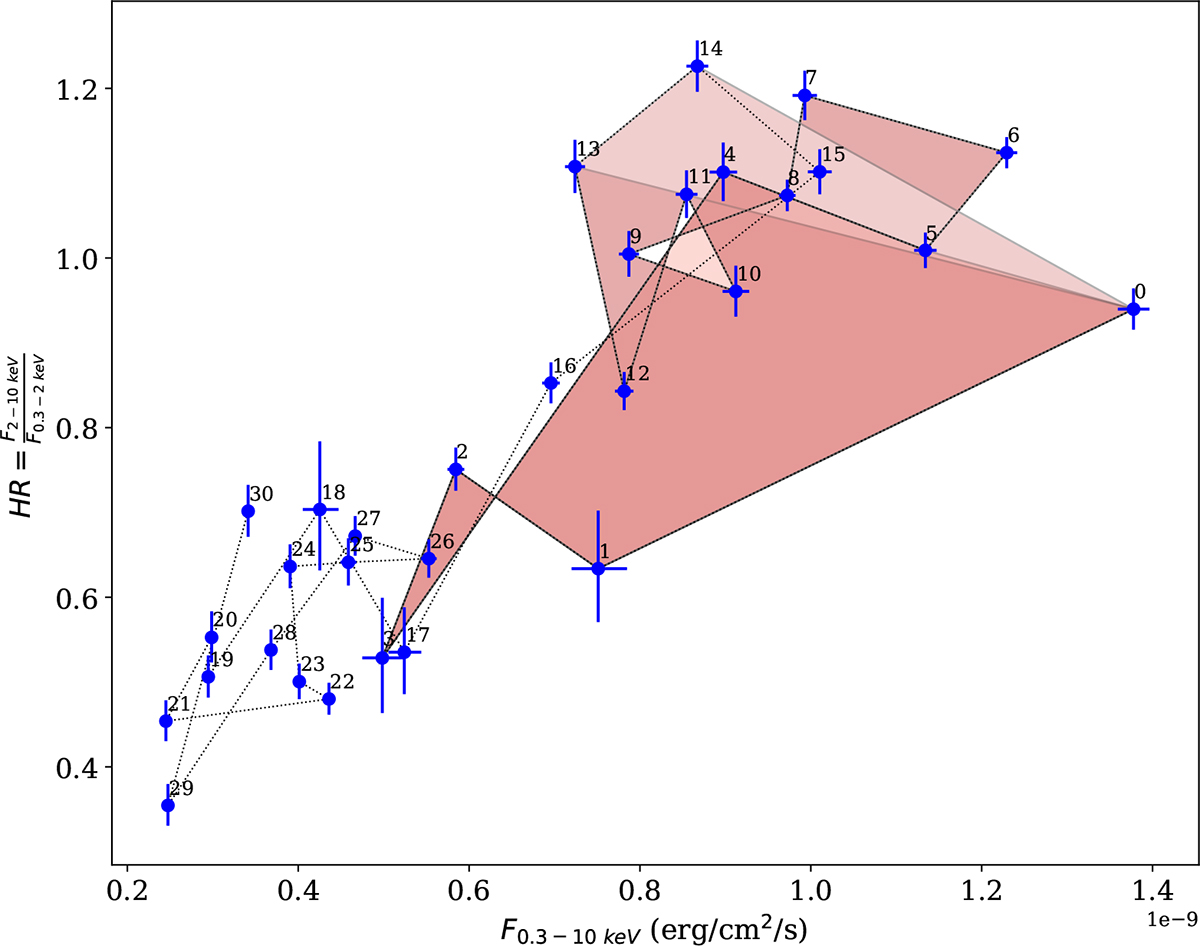
Fig. 5.
Download original image
Distribution in the HR − F0.3 − 10 keV plane for the entire follow-up campaign (periods 1 and 2). Numbers near the data points indicate the temporal order (0 to 30). Shaded orange areas represent the three loops initially identified and finally reject by the bootstrap algorithm. The three loops are: 0-6 CW, 0-14 CW, and 0-15 CW.
Current usage metrics show cumulative count of Article Views (full-text article views including HTML views, PDF and ePub downloads, according to the available data) and Abstracts Views on Vision4Press platform.
Data correspond to usage on the plateform after 2015. The current usage metrics is available 48-96 hours after online publication and is updated daily on week days.
Initial download of the metrics may take a while.