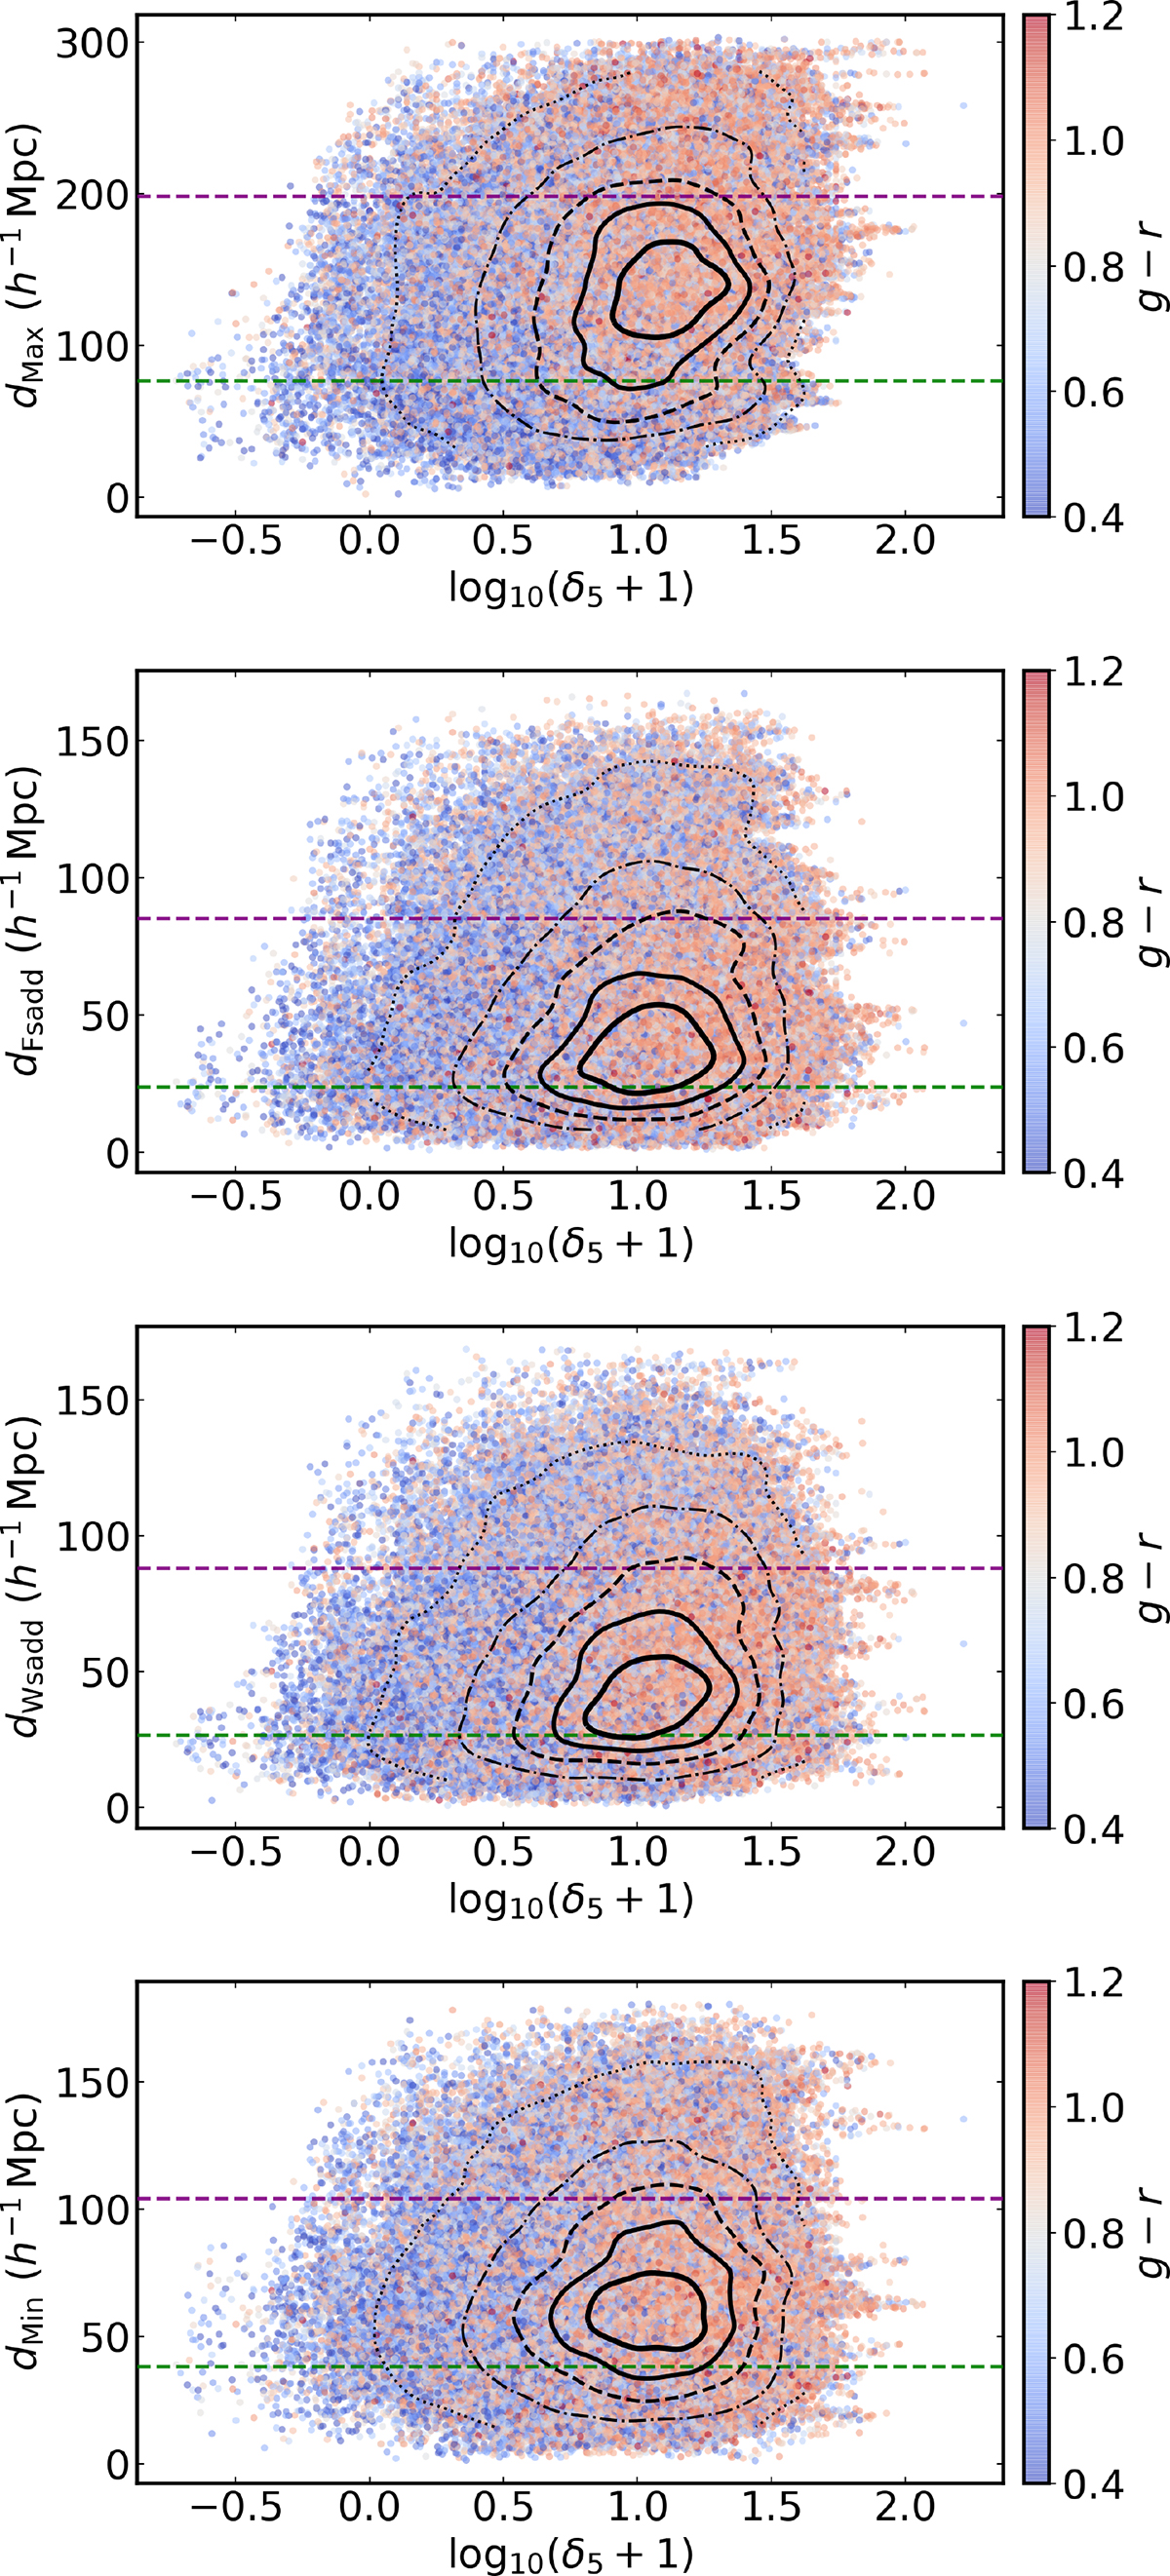
Fig. 4.
Download original image
Distribution of central galaxy colour as a function of cosmic web location and local overdensity. In each panel, a scatter diagram shows the relation between the distance to each critical point of the density field and the local group overdensity (log10(δ)) on 5 h−1 Mpc scales for all central galaxies in our sample, colour-coded by their g − r colour. From top to bottom, the panels illustrate the distribution with respect to the distance to (1) Maxima (dMax), (2) Filament saddles (dFsadd), (3) Wall saddles (dWSadd), and (4) Minima (dMin). The contour lines (black lines) represent the progressively lower density levels (down to 5% of the peak value). The horizontal dashed lines (green and magenta) mark the 15th (P15) and 85th (P85) percentiles of the distance distribution, respectively, used to define environment thresholds.
Current usage metrics show cumulative count of Article Views (full-text article views including HTML views, PDF and ePub downloads, according to the available data) and Abstracts Views on Vision4Press platform.
Data correspond to usage on the plateform after 2015. The current usage metrics is available 48-96 hours after online publication and is updated daily on week days.
Initial download of the metrics may take a while.