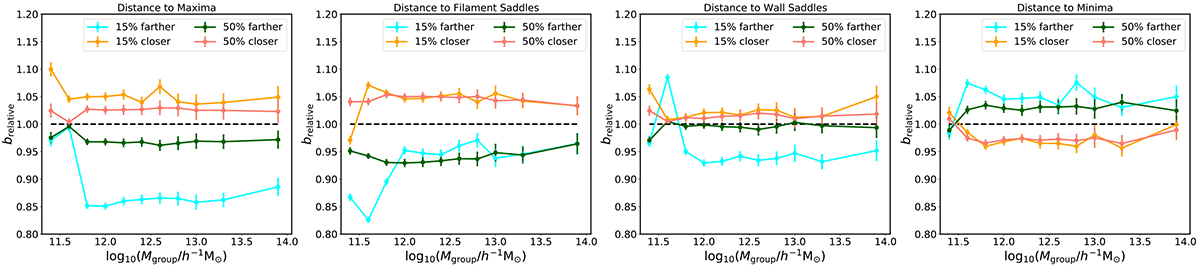
Fig. 6.
Download original image
Secondary halo bias based on the distance to the critical points of the cosmic web. Each panel shows the relative bias (brelative) as a function of the logarithm of the group mass (log10(Mgroup/h−1 M⊙)). The panels are organised into two rows and four columns; each column represents a specific cosmic web feature identified by the DisPerSE algorithm: Maxima (first column), Filament saddles (second), Wall saddles (third), and Minima (fourth). In each panel, the cyan and orange lines represent the 15% of galaxies farthest from and closest to the feature, respectively. The green and red lines represent the 50% of galaxies farthest from and closest to the feature, respectively. In each panel, the orange line represents the subset of galaxies closer to the feature, and the light blue line shows the subset of galaxies farther away. The dashed black line at brelative = 1.00 serves as a reference point for the relative bias. The error bars on each data point were calculated using the jackknife method.
Current usage metrics show cumulative count of Article Views (full-text article views including HTML views, PDF and ePub downloads, according to the available data) and Abstracts Views on Vision4Press platform.
Data correspond to usage on the plateform after 2015. The current usage metrics is available 48-96 hours after online publication and is updated daily on week days.
Initial download of the metrics may take a while.