Fig. 8.
Download original image
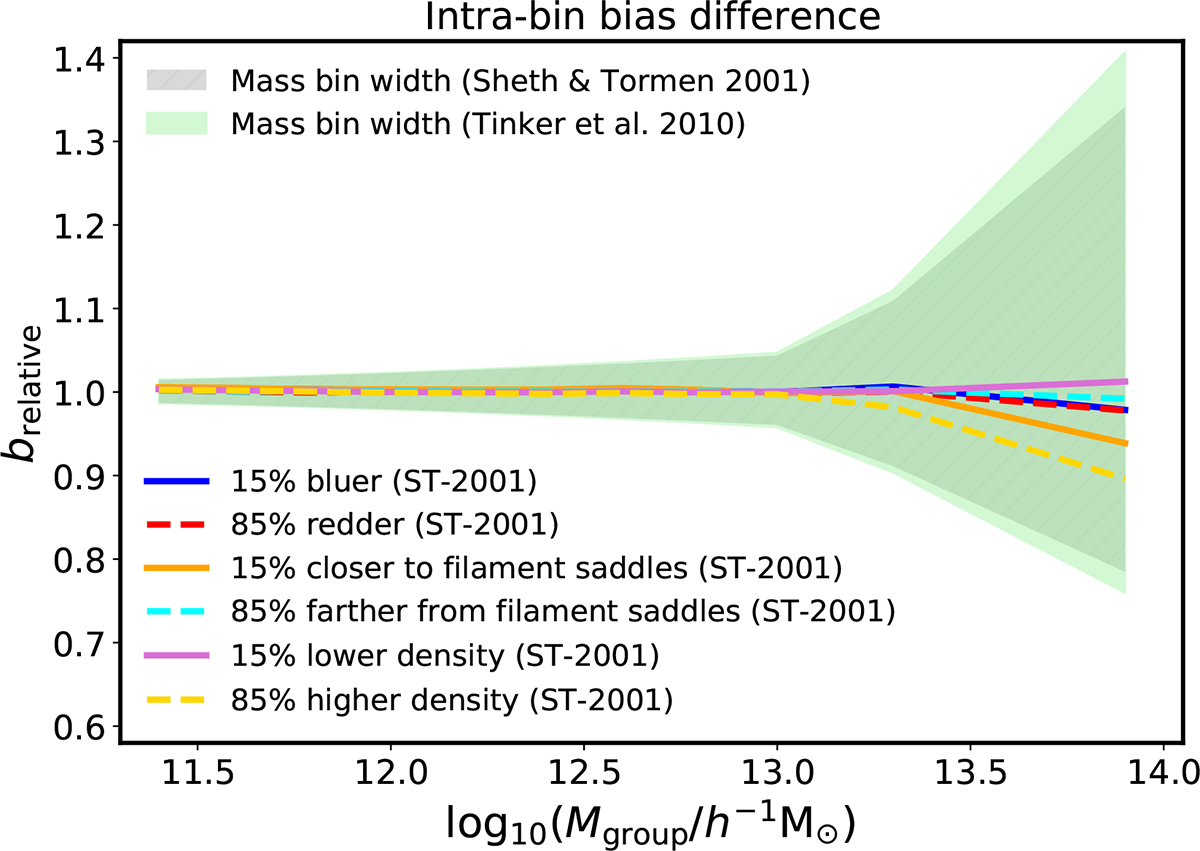
Assessment on the robustness of the secondary bias measurements against potential intra-bin mass dependences of group bias. Each line corresponds to the relative bias of the upper or lower subsets computed assuming the Sheth et al. (2001) halo bias model, where the mass assigned to each subsample corresponds to the mean mass. For reference, the shaded grey and green regions show the maximum intra-bin bias difference, obtained from the edges of the group mass bin; here both the Sheth et al. (2001) model and the Tinker et al. (2010) analytical fit are employed.
Current usage metrics show cumulative count of Article Views (full-text article views including HTML views, PDF and ePub downloads, according to the available data) and Abstracts Views on Vision4Press platform.
Data correspond to usage on the plateform after 2015. The current usage metrics is available 48-96 hours after online publication and is updated daily on week days.
Initial download of the metrics may take a while.