Fig. 9.
Download original image
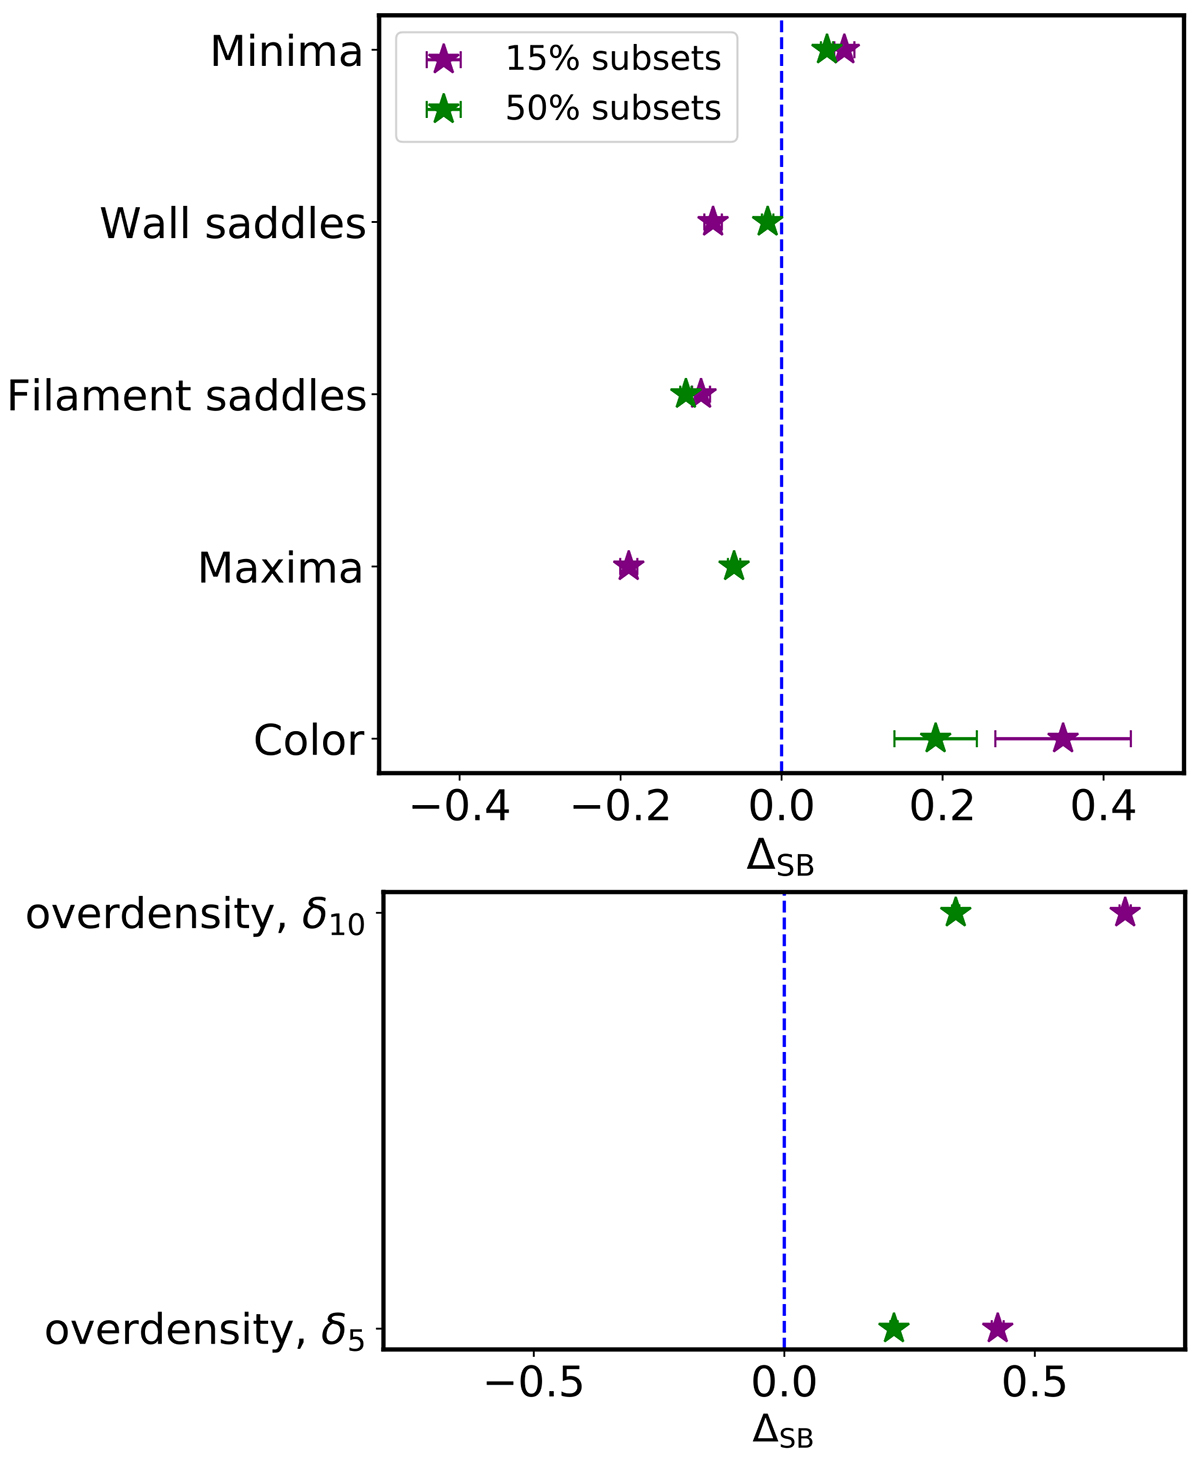
Comparison of the secondary bias signal for different properties. The stars represent the difference between the average relative bias of the upper subsets and the average relative bias of the lower subsets, in the mass range of log10(Mgroup/h−1 M⊙) 12 and 12.5. The results are shown for the 15% (purple) and 50% (green) subsets. The properties analysed are local density, Minimum density, Wall saddles, Filament saddles, Maximum density, and colour.
Current usage metrics show cumulative count of Article Views (full-text article views including HTML views, PDF and ePub downloads, according to the available data) and Abstracts Views on Vision4Press platform.
Data correspond to usage on the plateform after 2015. The current usage metrics is available 48-96 hours after online publication and is updated daily on week days.
Initial download of the metrics may take a while.