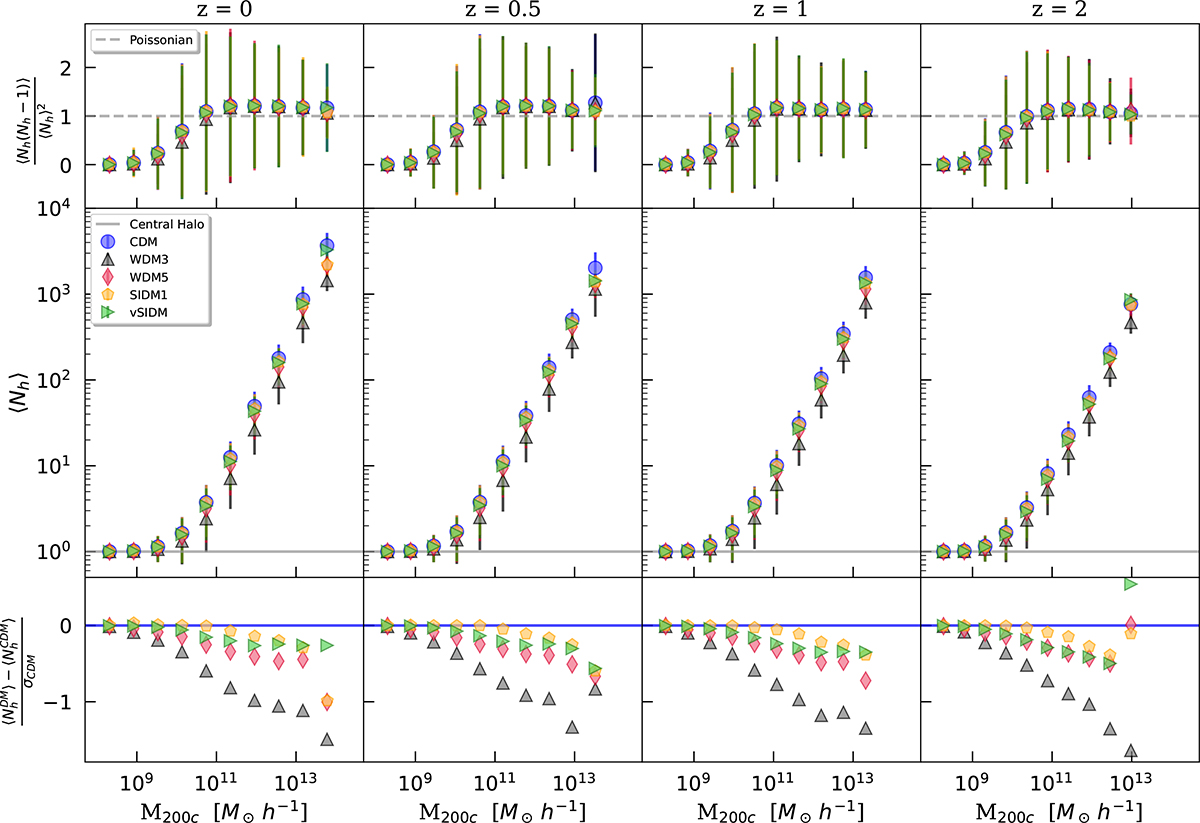
Fig. 3.
Download original image
From left to right: Average number of dark matter pairs (top panels), halo occupation function (middle panels) and residuals (bottom panels) with respect to the CDM reference level (solid blue line) as a function of M200c in box 50/A in the range 0 < z < 2 for CDM (blue circles), WDM3 (black triangles), WDM5 (crimson diamonds), SIDM1 (gold pentagons), and vSIDM (green triangles). The corresponding errors are computed with the standard deviation of the measurements for each mass bin. The dashed horizontal gray line represents the expected ratio for a Poissonian distribution. The solid horizontal gray line marks the central halo that always exists for M200c > Mmin.
Current usage metrics show cumulative count of Article Views (full-text article views including HTML views, PDF and ePub downloads, according to the available data) and Abstracts Views on Vision4Press platform.
Data correspond to usage on the plateform after 2015. The current usage metrics is available 48-96 hours after online publication and is updated daily on week days.
Initial download of the metrics may take a while.