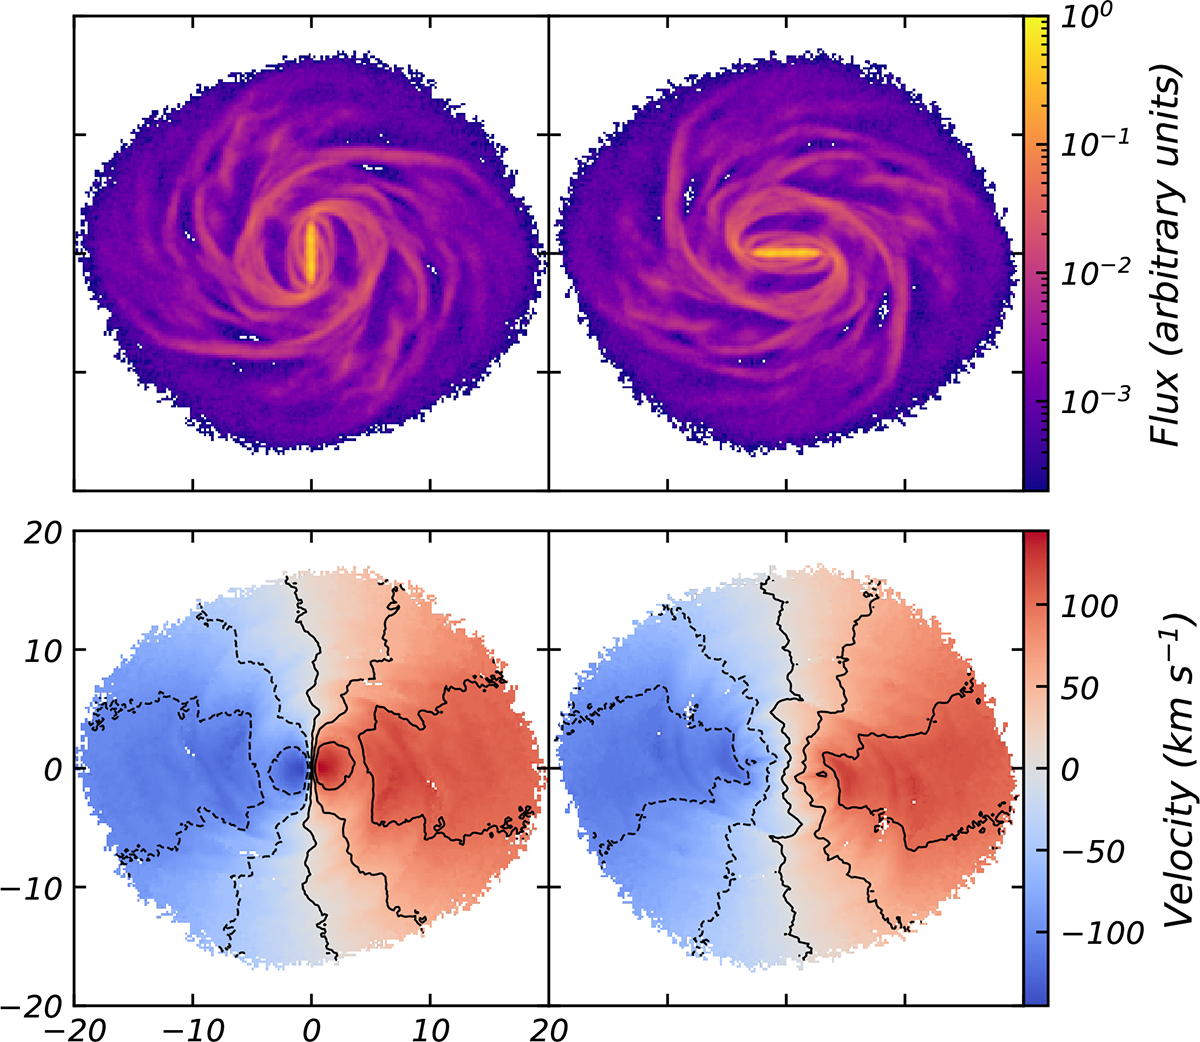
Fig. 1.
Download original image
Data moment maps of the gas in the central 20 kpc produced with the symmetrized gSb at the selected snapshot (T = 500 Myr). The pixel scale is 0.2 kpc. The point (0, 0) corresponds to the center of the bar. The gas component has been inclined by itrue = 30° and rotated so the bar is aligned with the kinematic axes: the galaxy minor axis (left column) and major axis (right column). First row: Integrated intensity maps (moment 0) in logarithmic norm. Second row: Mean velocity field (moment 1) maps. The black curves show the isovelocity contours of levels [−150, −100, −50, 0, 50, 100, 150] km s−1.
Current usage metrics show cumulative count of Article Views (full-text article views including HTML views, PDF and ePub downloads, according to the available data) and Abstracts Views on Vision4Press platform.
Data correspond to usage on the plateform after 2015. The current usage metrics is available 48-96 hours after online publication and is updated daily on week days.
Initial download of the metrics may take a while.