Fig. 2.
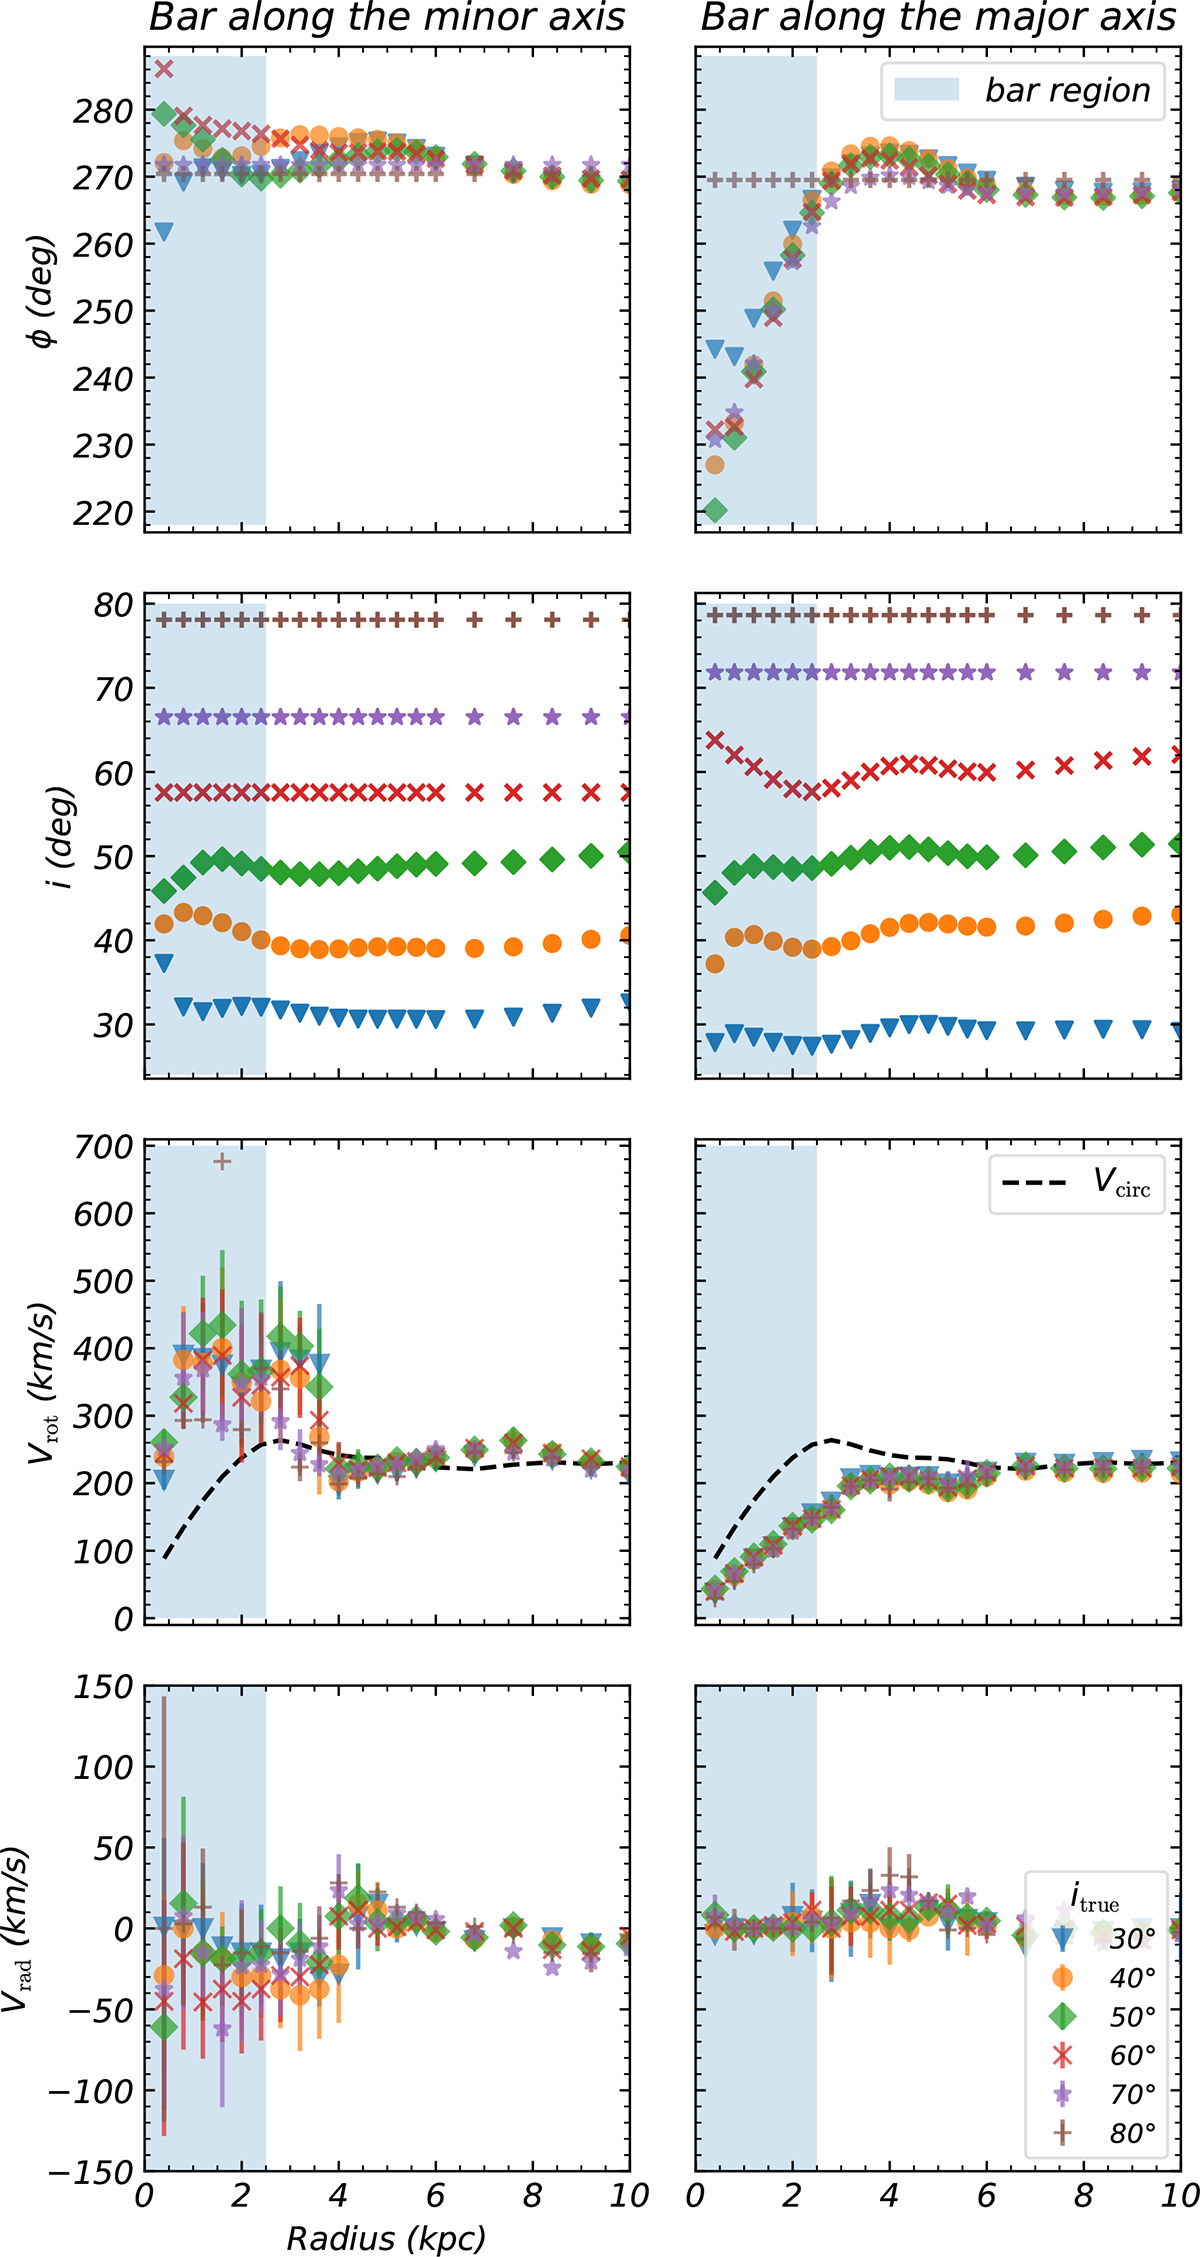
Download original image
Each column corresponds to one bar orientation of Fig. 1. Left column: Bar along the minor axis. Right column: Bar along the major axis. Parameters fitted by 3D-Barolo with a free PA and a free inclination angle. Each marker corresponds to one “true” inclination value itrue ∈ ±[30° ,80° ], the one we input to create the cube. The different parameters are plotted as a function of the galactocentric radius and the blue area highlights the bar region. First row: PA obtained at the end of step 1. Second row: Inclination angles obtained at the end of step 1. Third row: Rotation curves obtained after step 2. The black curve represents the expected circular velocity (Eq. (6)) computed from the gravitational potential (Eq. (4)). Fourth row: Radial velocity with the sign convention: negative toward the center.
Current usage metrics show cumulative count of Article Views (full-text article views including HTML views, PDF and ePub downloads, according to the available data) and Abstracts Views on Vision4Press platform.
Data correspond to usage on the plateform after 2015. The current usage metrics is available 48-96 hours after online publication and is updated daily on week days.
Initial download of the metrics may take a while.