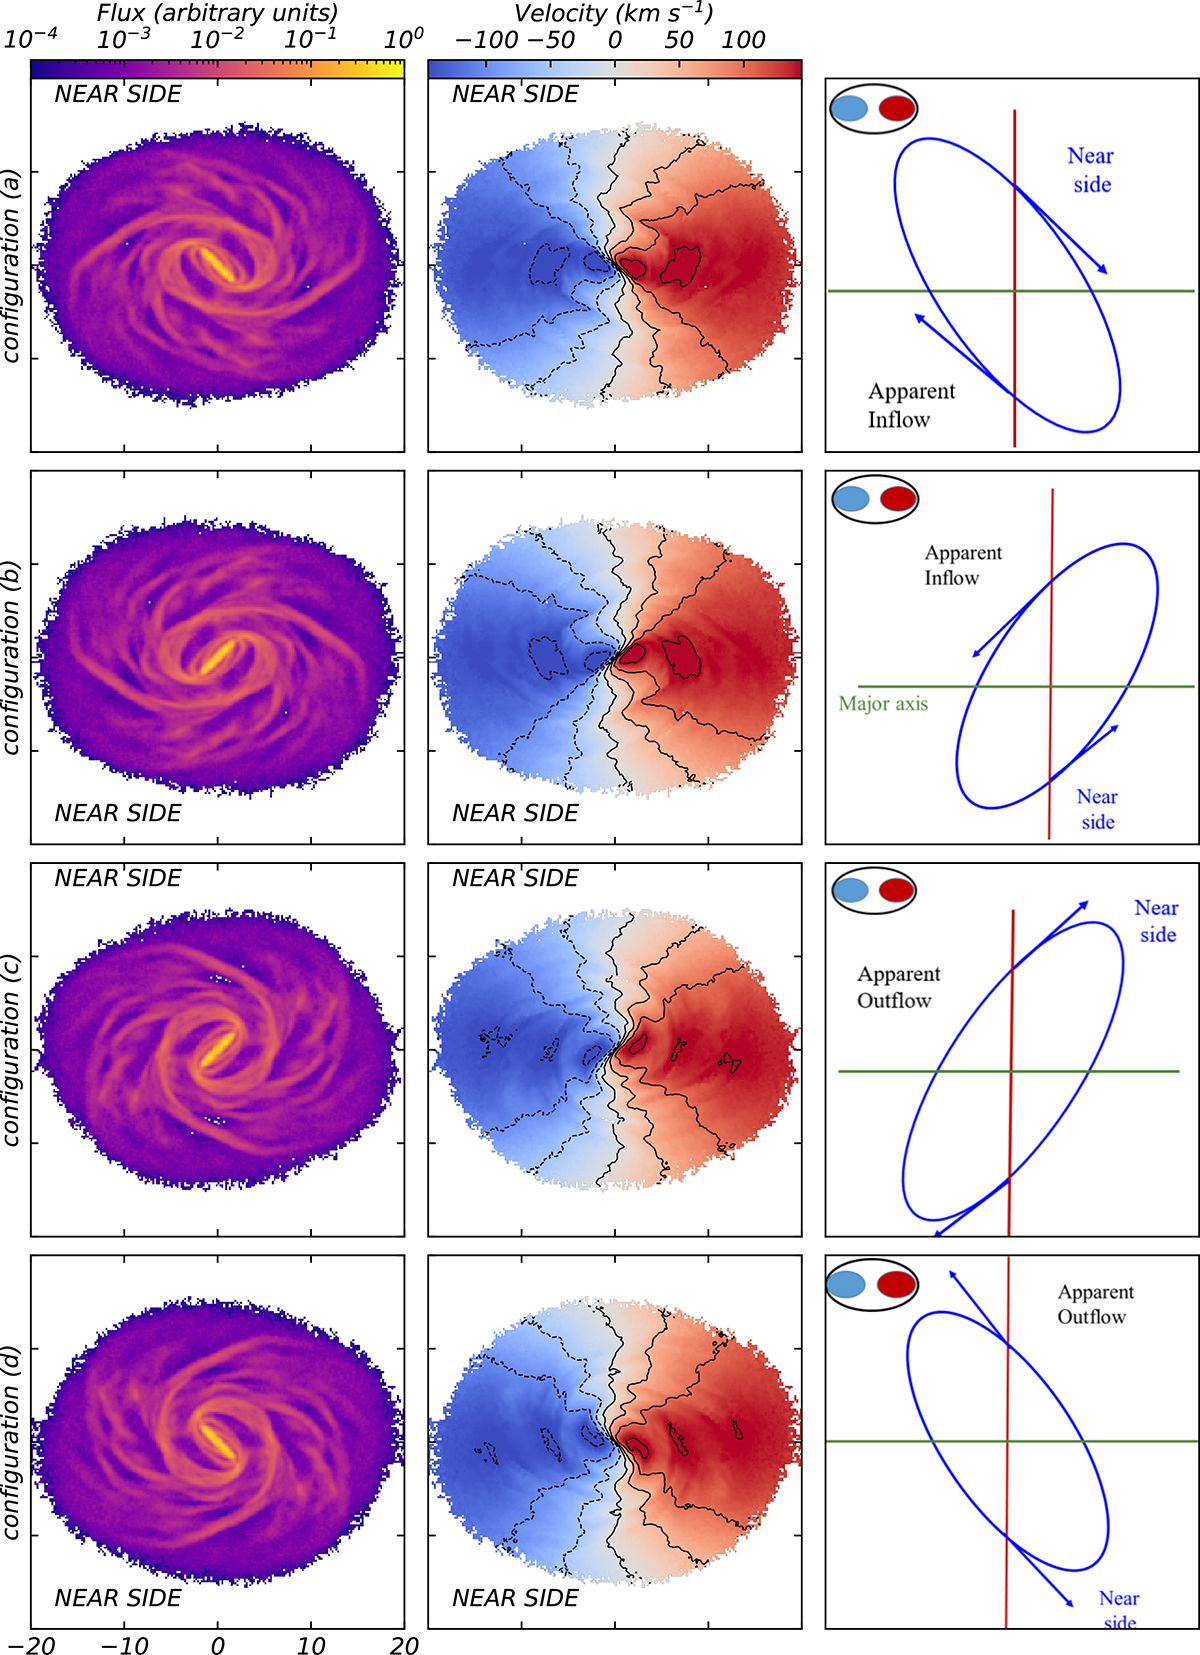
Fig. 3.
Download original image
Each row corresponds to one configuration. Left column: Moment 0 maps. Middle column: Moment 1 maps. The gas component has been inclined by itrue = 40° and rotated so the bar could form a 45° angle with respect to the galaxy kinematic axes. The image parameters and the isovelocity contours are the same as in Fig. 1. Right column: Corresponding bar diagram with the radial motion interpretation according to the gas velocity vector projected on the minor axis in red and the major axis in green.
Current usage metrics show cumulative count of Article Views (full-text article views including HTML views, PDF and ePub downloads, according to the available data) and Abstracts Views on Vision4Press platform.
Data correspond to usage on the plateform after 2015. The current usage metrics is available 48-96 hours after online publication and is updated daily on week days.
Initial download of the metrics may take a while.