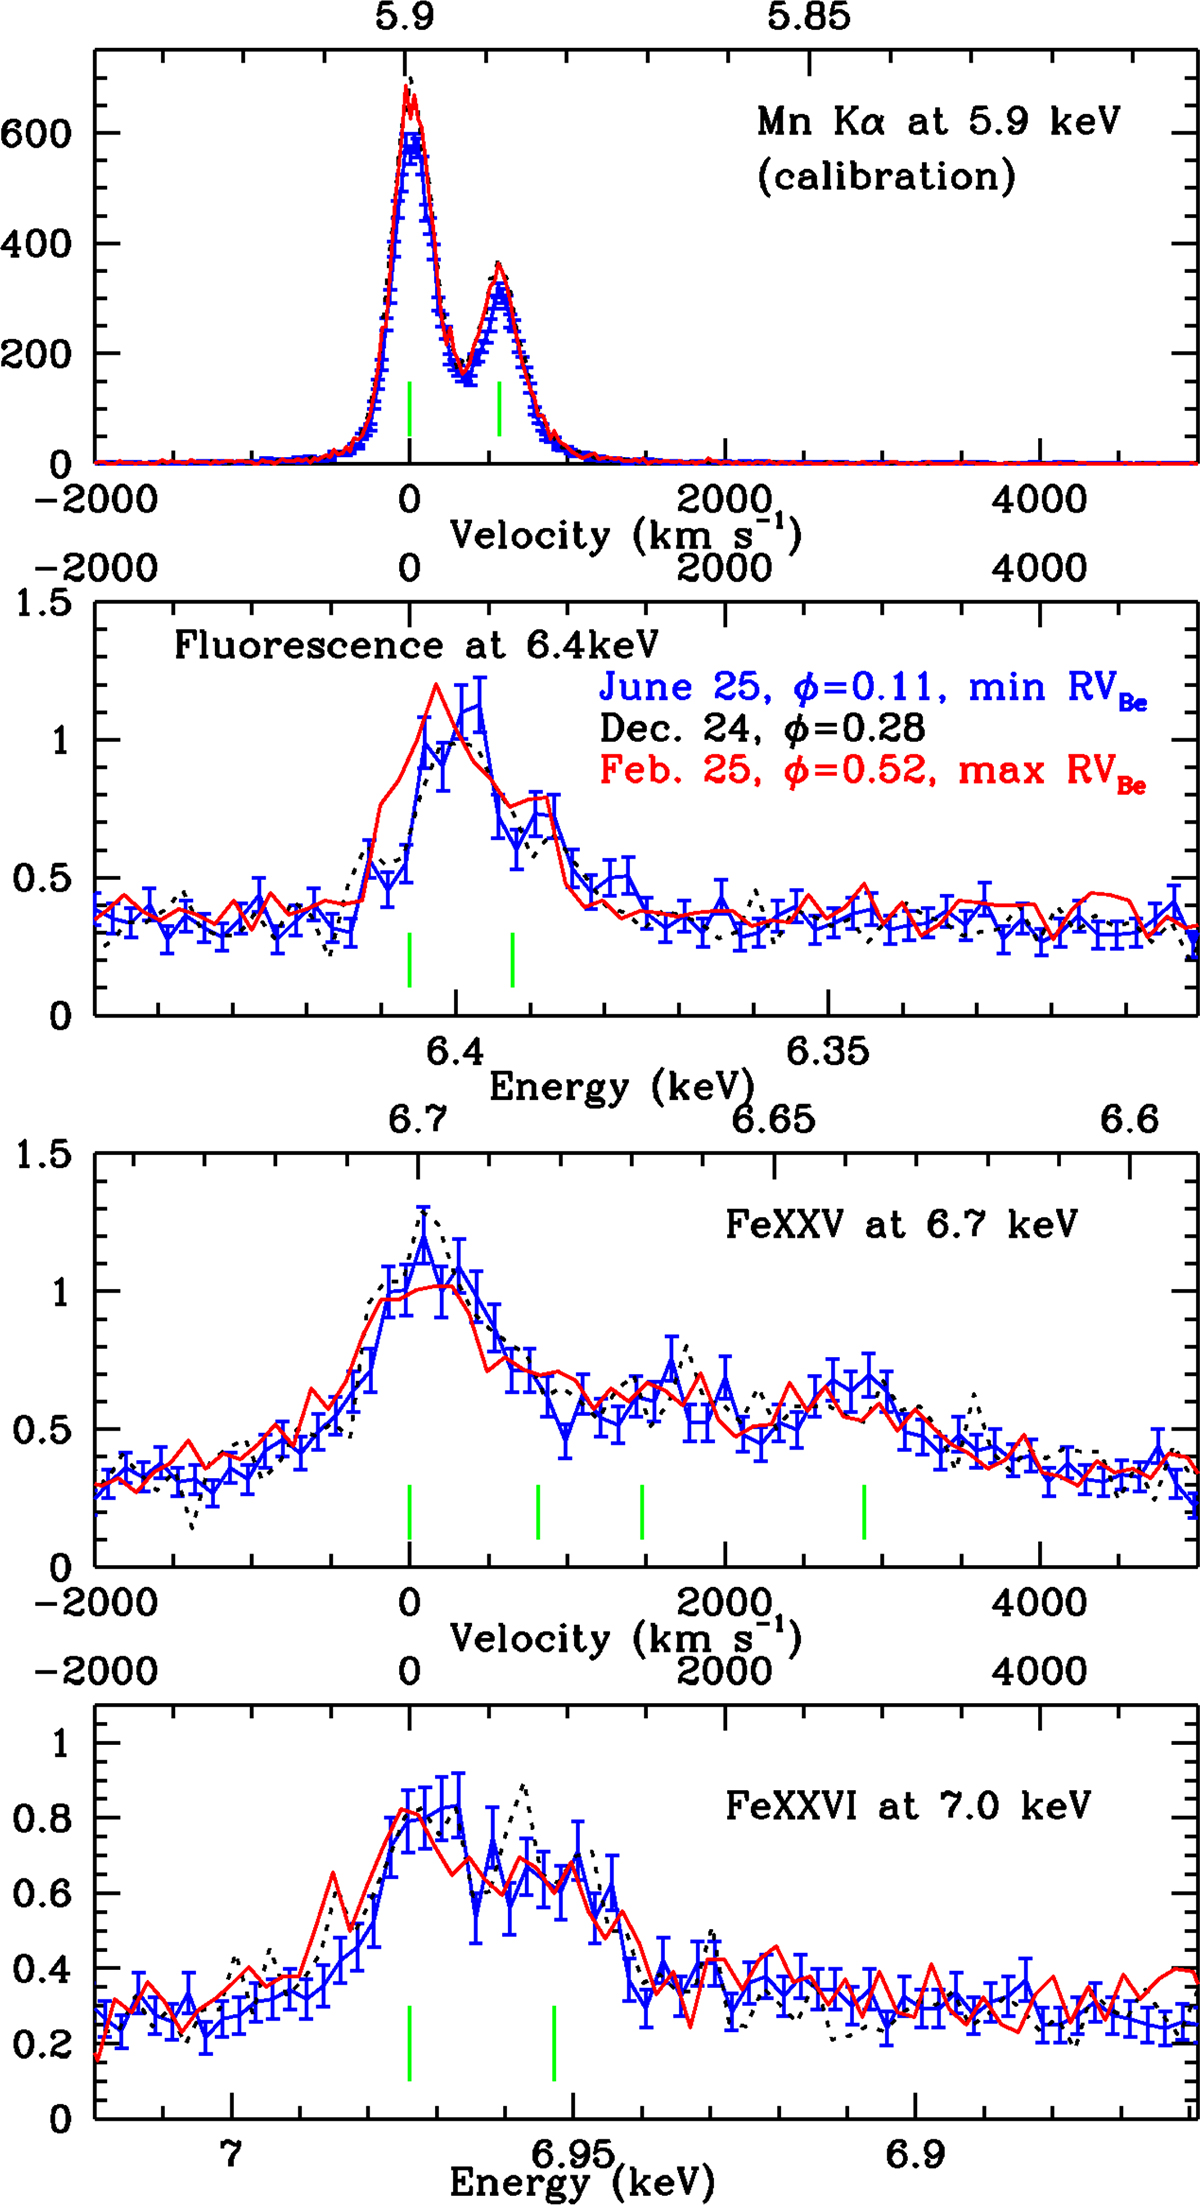
Fig. 3.
Download original image
Observed profile of the three iron features in the γ Cas spectrum: fluorescence at 6.4 keV (second panel) and Fe XXV and Fe XXVI contributions (third and fourth panels, respectively). For comparison, the stationary calibration line of Mn Kα in the three observations is also shown in the first panel. In these panels, velocities are calculated using rest energies of 5.89879, 6.40546, 6.70042, and 6.97317 keV (from top to bottom), and green tick marks indicate the main line components. The observation at maximum Be star orbital velocity (drawn in red) shows blueshifted iron lines relative to the observation at minimum Be star orbital velocity (drawn in blue). Typical 1-σ error bars are shown for the latter observation.
Current usage metrics show cumulative count of Article Views (full-text article views including HTML views, PDF and ePub downloads, according to the available data) and Abstracts Views on Vision4Press platform.
Data correspond to usage on the plateform after 2015. The current usage metrics is available 48-96 hours after online publication and is updated daily on week days.
Initial download of the metrics may take a while.