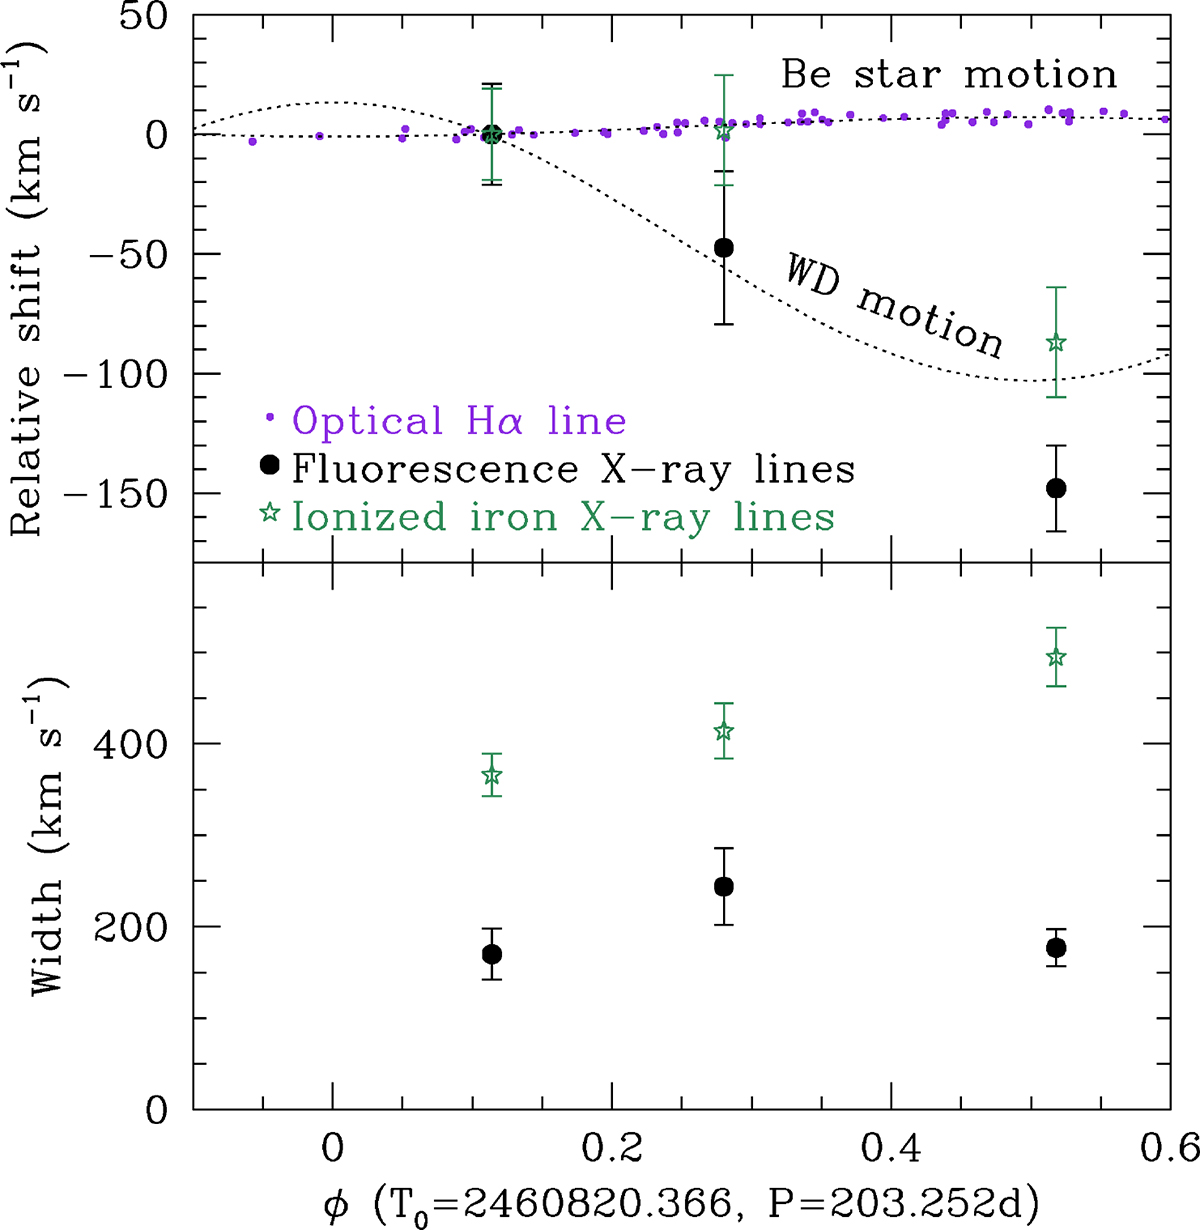
Fig. 4.
Download original image
Shifts (top) and widths (bottom) of the iron features measure on γ Cas XRISM spectra. Fluorescence lines are shown as black dots, ionised lines with green stars. As in Table 1, the error bars are 1-σ uncertainties. In the top panel, all velocities are relative to that at the first observing phase and are compared to the expected orbital motion of both the Be star and its white dwarf companion, demonstrating that the iron lines follow the white dwarf motion. For comparison, small violet points indicate velocities measured on the Hα line, which is typically associated with the Be disc, at the time of the X-ray campaign (Nazé et al. 2025).
Current usage metrics show cumulative count of Article Views (full-text article views including HTML views, PDF and ePub downloads, according to the available data) and Abstracts Views on Vision4Press platform.
Data correspond to usage on the plateform after 2015. The current usage metrics is available 48-96 hours after online publication and is updated daily on week days.
Initial download of the metrics may take a while.