Fig. 2
Download original image
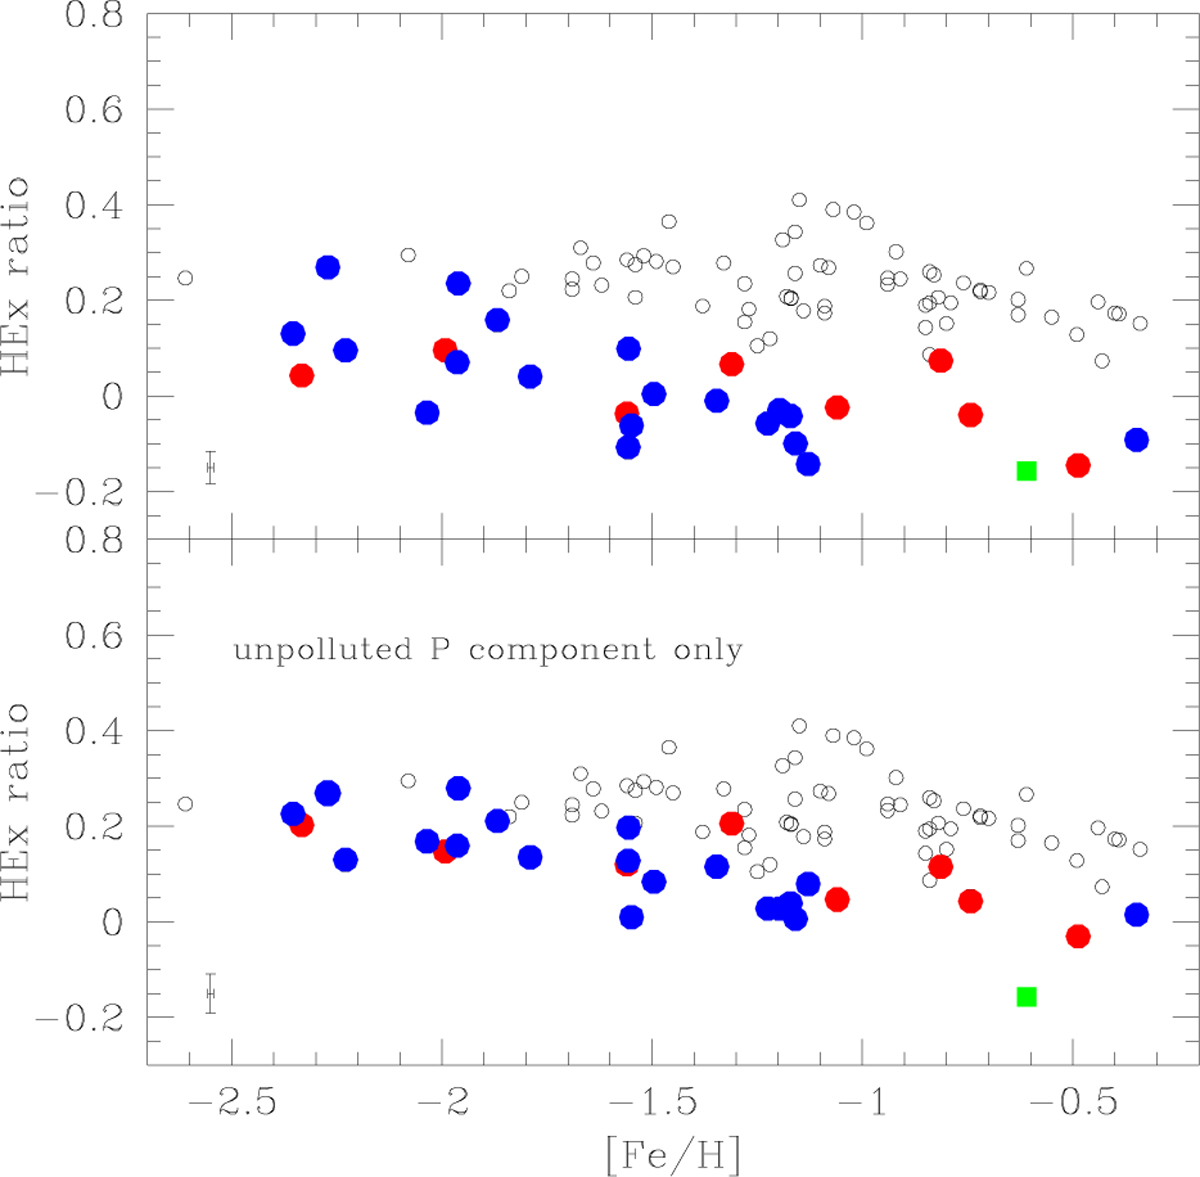
Ratio of the average of hydrostatic α-elements O and Mg to the average of explosive α-elements Si, Ca, and Ti (HEx ratio) for our sample of GCs. In the lower panel, the ratio is computed using only stars of the unpolluted P component in each GC (see text). The blue and red symbols show accreted and in situ GCs, respectively, and the empty grey circles show field stars from Gratton et al. (2003). The green square shows field stars in the core of Sgr dSph. A typical error is shown in both panels (average from all GCs).
Current usage metrics show cumulative count of Article Views (full-text article views including HTML views, PDF and ePub downloads, according to the available data) and Abstracts Views on Vision4Press platform.
Data correspond to usage on the plateform after 2015. The current usage metrics is available 48-96 hours after online publication and is updated daily on week days.
Initial download of the metrics may take a while.