Fig. 4
Download original image
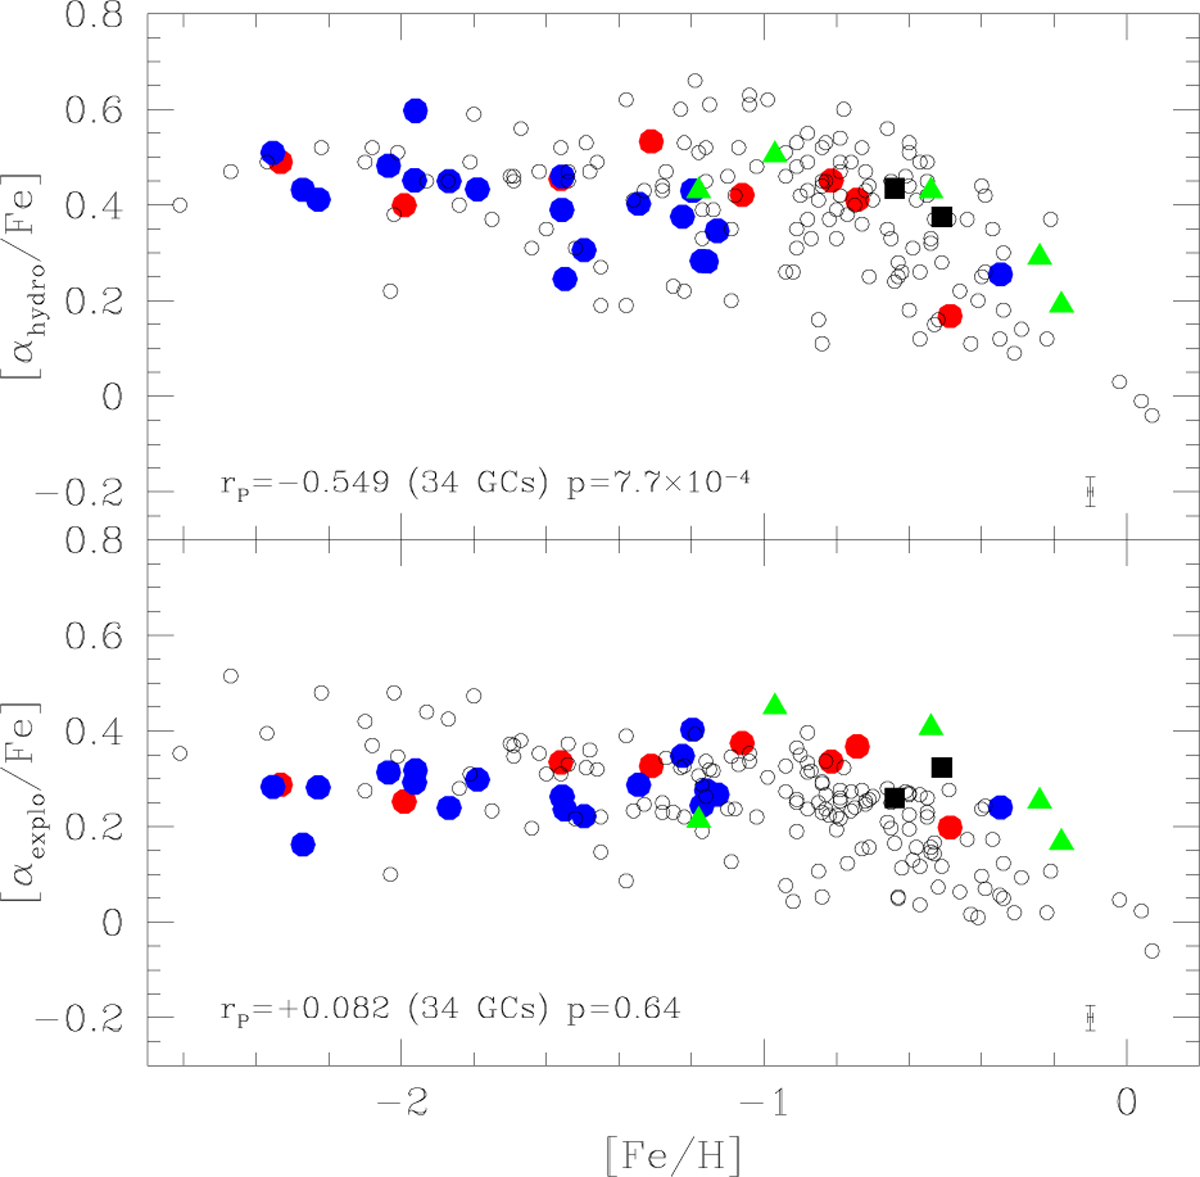
Abundance ratios of the hydrostatic (upper panel) and explosive (lower panel) α-elements in the GCs of our extended sample. The blue and red points indicate accreted and in situ GCs. The black squares show disc GCs, and the green triangles show bulge GCs from the literature. The Pearson correlation coefficient and two-tailed probability are listed. Only Mg is used to represent the hydrostatic species in field stars.
Current usage metrics show cumulative count of Article Views (full-text article views including HTML views, PDF and ePub downloads, according to the available data) and Abstracts Views on Vision4Press platform.
Data correspond to usage on the plateform after 2015. The current usage metrics is available 48-96 hours after online publication and is updated daily on week days.
Initial download of the metrics may take a while.