Open Access
Fig. 6
Download original image
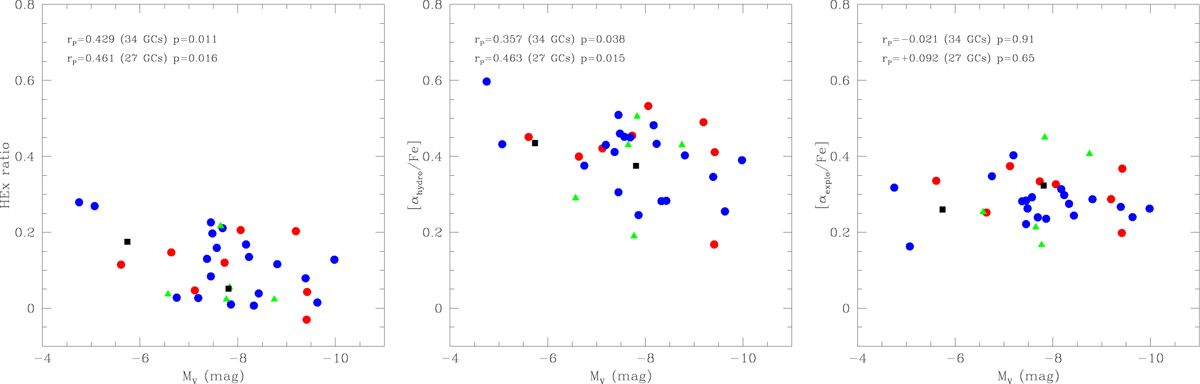
HEx ratio (left panel), [αhydro/Fe] (middle panel), and [αexplo/Fe] ratio (right panel) as a function of the global absolute luminosity of GCs (Harris 2010). The results of the linear regression refer to the extended sample (upper row) and to our original sample (lower row). The symbols are the same as in Fig. 4.
Current usage metrics show cumulative count of Article Views (full-text article views including HTML views, PDF and ePub downloads, according to the available data) and Abstracts Views on Vision4Press platform.
Data correspond to usage on the plateform after 2015. The current usage metrics is available 48-96 hours after online publication and is updated daily on week days.
Initial download of the metrics may take a while.