Open Access
Fig. 5.
Download original image
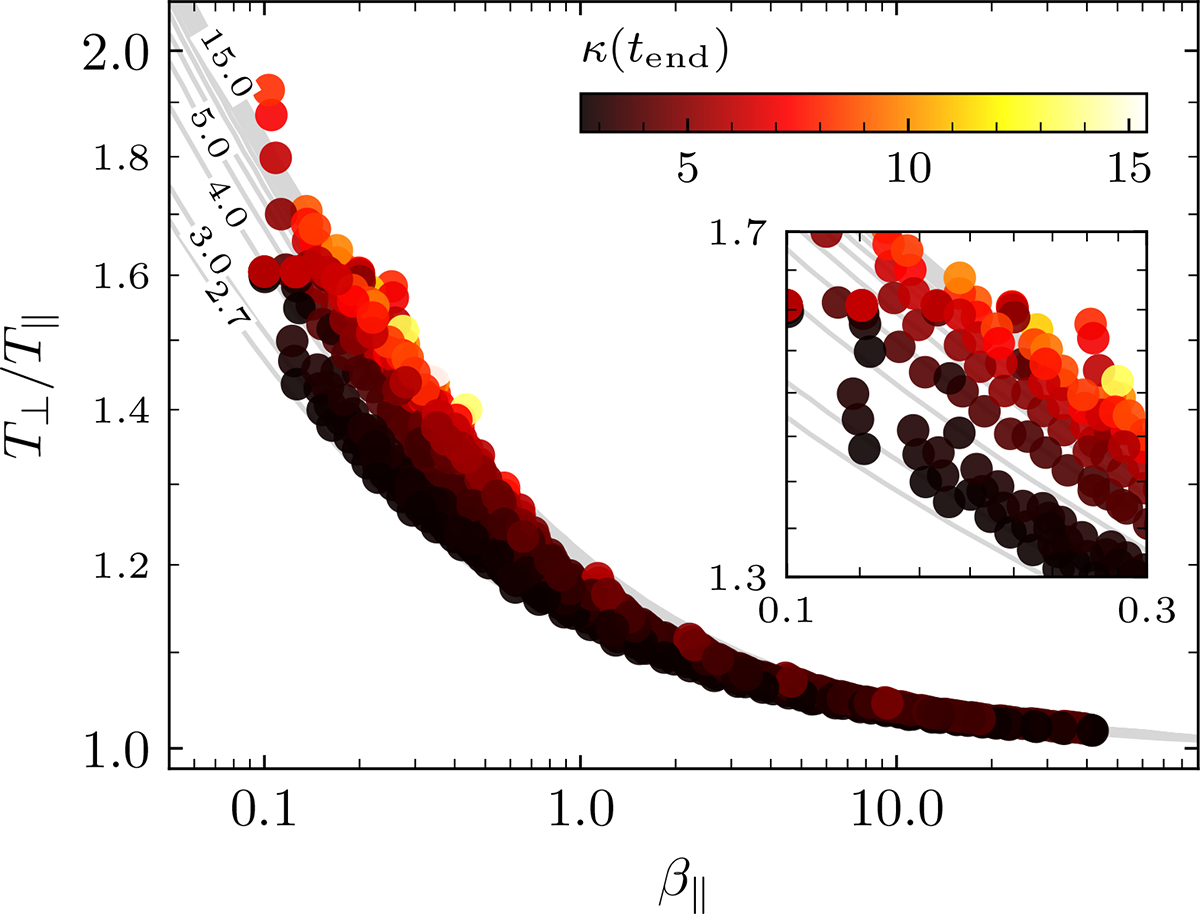
Diagram of T⊥/T∥ vs. β∥, showing final values of κ(tend) (color-coded) obtained for the final states (filled circles), which reach the instability thresholds (light gray, γmax/|Ωe| = 5 × 10⁻³) predicted by linear theory for different initial values of κ(0) (as is partially indicated).
Current usage metrics show cumulative count of Article Views (full-text article views including HTML views, PDF and ePub downloads, according to the available data) and Abstracts Views on Vision4Press platform.
Data correspond to usage on the plateform after 2015. The current usage metrics is available 48-96 hours after online publication and is updated daily on week days.
Initial download of the metrics may take a while.