Fig. 3
Download original image
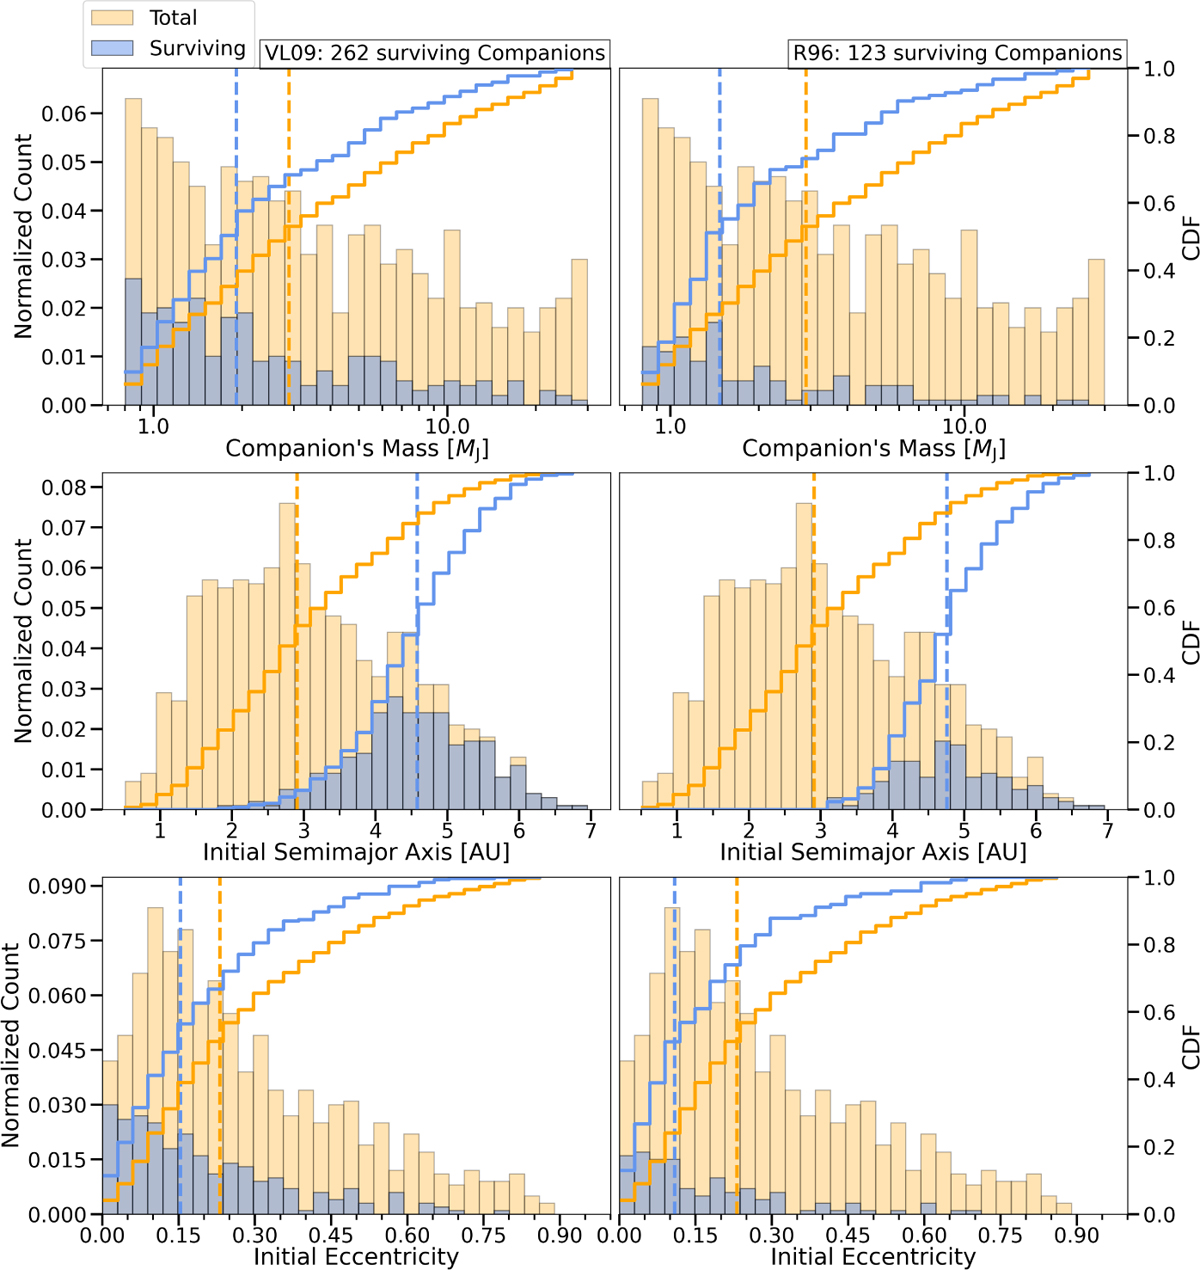
Survival of substellar companions as function of companion mass (top), initial semimajor axis (middle), and initial eccentricity (bottom). The left panels represent results when considering the tidal force model by VL09, while the right panels show results when using the tidal force model by R96. All distributions are normalized by the total number of stars (1000). The number of surviving companions is indicated in the figure for each model (blue histogram). The vertical lines correspond to the median value of each sample. The solid lines correspond to the cumulative distributions. In general, the initial distributions of surviving companions (orange) are shifted toward lower masses, larger semimajor axes, and smaller eccentricities compared to the initial values of all companions (blue). These effects are slightly more pronounced for stronger tides (right panels).
Current usage metrics show cumulative count of Article Views (full-text article views including HTML views, PDF and ePub downloads, according to the available data) and Abstracts Views on Vision4Press platform.
Data correspond to usage on the plateform after 2015. The current usage metrics is available 48-96 hours after online publication and is updated daily on week days.
Initial download of the metrics may take a while.