Fig. 4.
Download original image
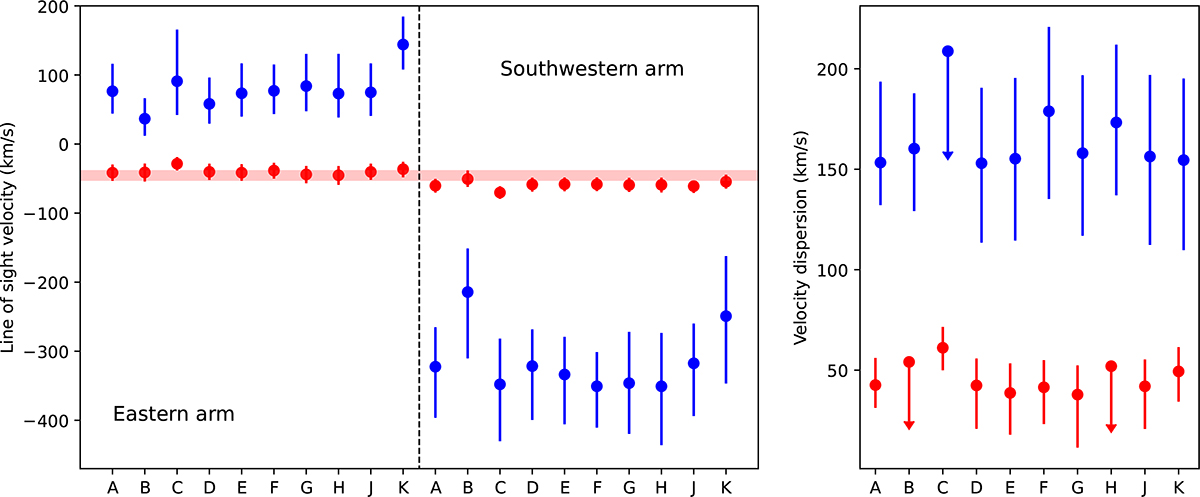
Left: Line-of-sight velocity of the cooler (blue) and hotter (red) gas phases, for each of the two arm pointings and each of the various models and assumptions discussed in Sections 4.3.3–4.3.4. The 1σ statistical confidence interval of the l.o.s. velocity of the NW offset is shown as a light red band for comparison. This parameter is insensitive to the model variations, with a standard deviation of only 0.5 km/s between the different models presented. Right: corresponding velocity dispersions of the cooler and hotter gas.
Current usage metrics show cumulative count of Article Views (full-text article views including HTML views, PDF and ePub downloads, according to the available data) and Abstracts Views on Vision4Press platform.
Data correspond to usage on the plateform after 2015. The current usage metrics is available 48-96 hours after online publication and is updated daily on week days.
Initial download of the metrics may take a while.