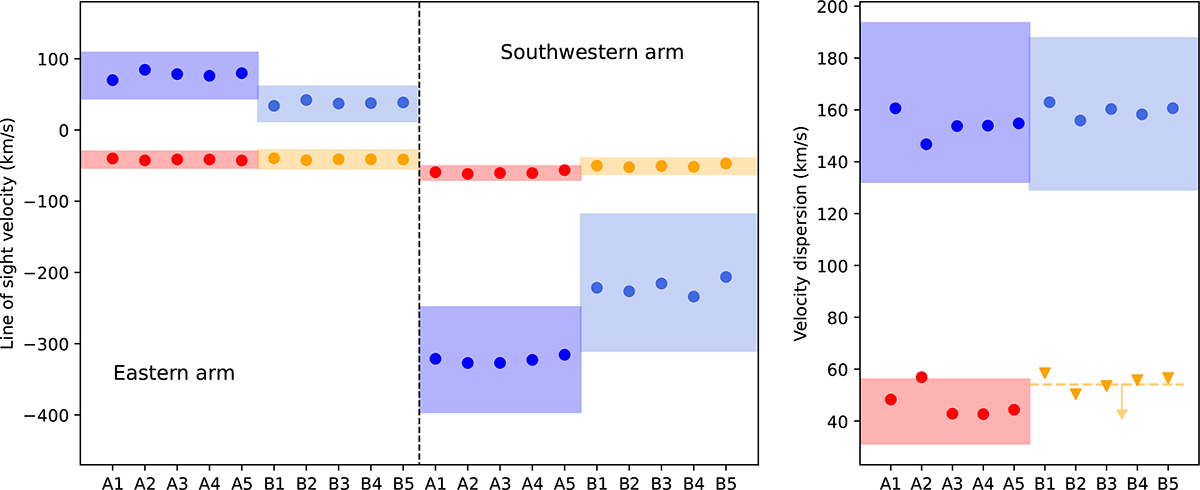
Fig. C.1.
Download original image
The impact of various calibration uncertainties on the velocities of the E and SW arms. Model variants (1,2): scattering from the cluster center is decreased and increased by ±30%. Model variants (3,4): the NXB level is decreased and increased by ±10%. Model variant 5: the energy dependent effective area is modified according to Eq. B.1. These modifications are applied both to "model A" (for which the velocities of the hotter component are plotted in red, and for the cooler component in blue), and to "model B" (for which the results of the hotter/cooler component are shown in orange and light blue, respectively). In each case, the best-fit value is shown as a circle, or in the case a parameter was consistent with 0 we show the 2σ upper limit as a triangle. The bands of corresponding colors show the ±1σ statistical uncertainty interval of the fiducial models A and B (as described in Sections 4.3.3 and 4.3.4, without any systematic variations included).
Current usage metrics show cumulative count of Article Views (full-text article views including HTML views, PDF and ePub downloads, according to the available data) and Abstracts Views on Vision4Press platform.
Data correspond to usage on the plateform after 2015. The current usage metrics is available 48-96 hours after online publication and is updated daily on week days.
Initial download of the metrics may take a while.