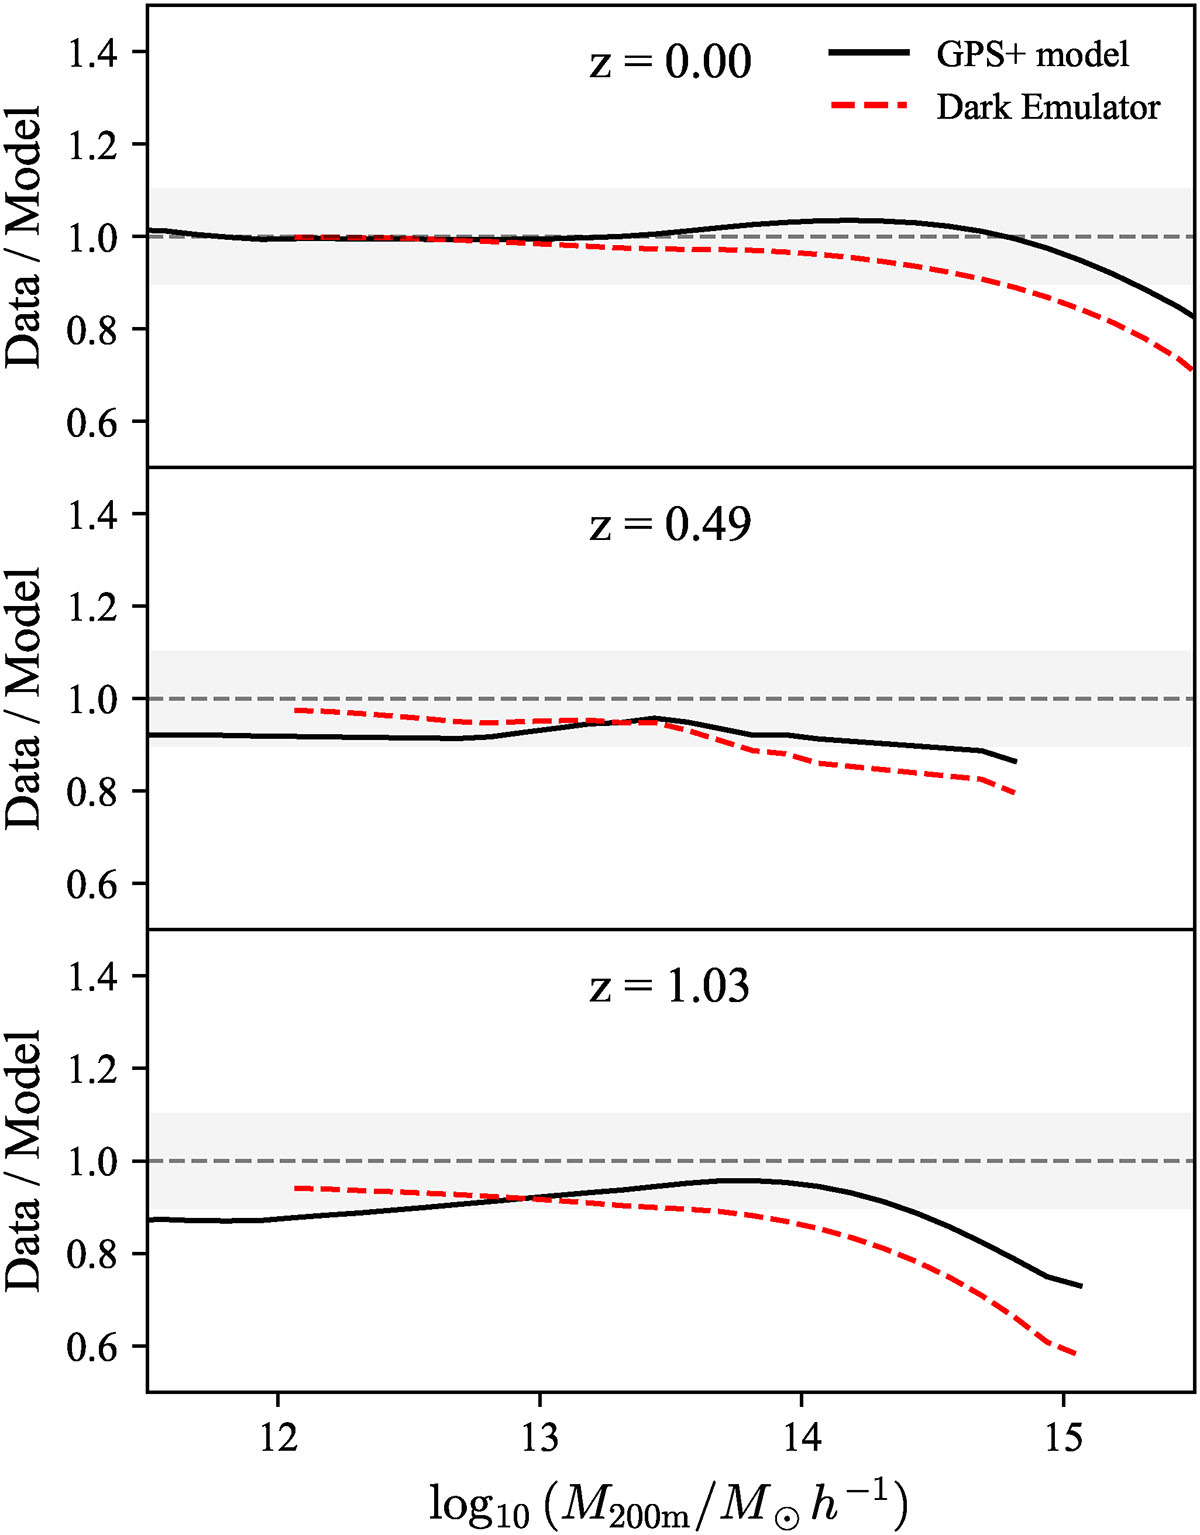
Fig. F.1.
Download original image
Comparison of halo mass function ratios using two different theoretical predictions. Each panel shows the ratio of the data to the GPS+model prediction and to the Dark Emulator prediction, highlighting relative differences between the two approaches. The panels correspond to redshifts z = 0.0 (left), z = 0.49 (middle), and z = 1.03 (right).
Current usage metrics show cumulative count of Article Views (full-text article views including HTML views, PDF and ePub downloads, according to the available data) and Abstracts Views on Vision4Press platform.
Data correspond to usage on the plateform after 2015. The current usage metrics is available 48-96 hours after online publication and is updated daily on week days.
Initial download of the metrics may take a while.