Fig. 9.
Download original image
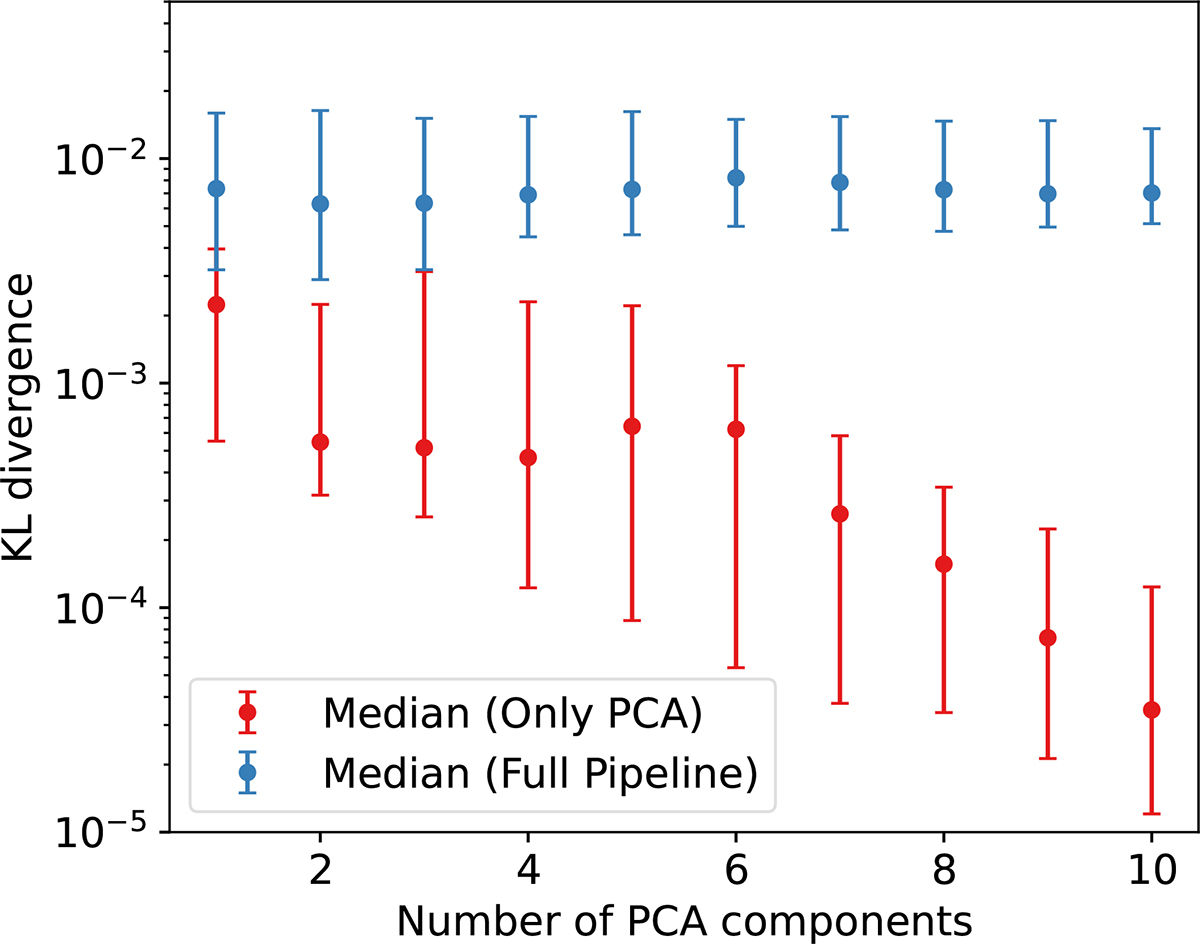
Median KL divergence as a function of the number of PCA components. Error bars indicate the 16th–84th percentile range across the test set (290 PDFs). Red points correspond to an analysis similar to that of Figure 5, accounting only for information loss due to dimensionality reduction. Blue points include the full pipeline, incorporating ML prediction errors.
Current usage metrics show cumulative count of Article Views (full-text article views including HTML views, PDF and ePub downloads, according to the available data) and Abstracts Views on Vision4Press platform.
Data correspond to usage on the plateform after 2015. The current usage metrics is available 48-96 hours after online publication and is updated daily on week days.
Initial download of the metrics may take a while.