Fig. 1.
Download original image
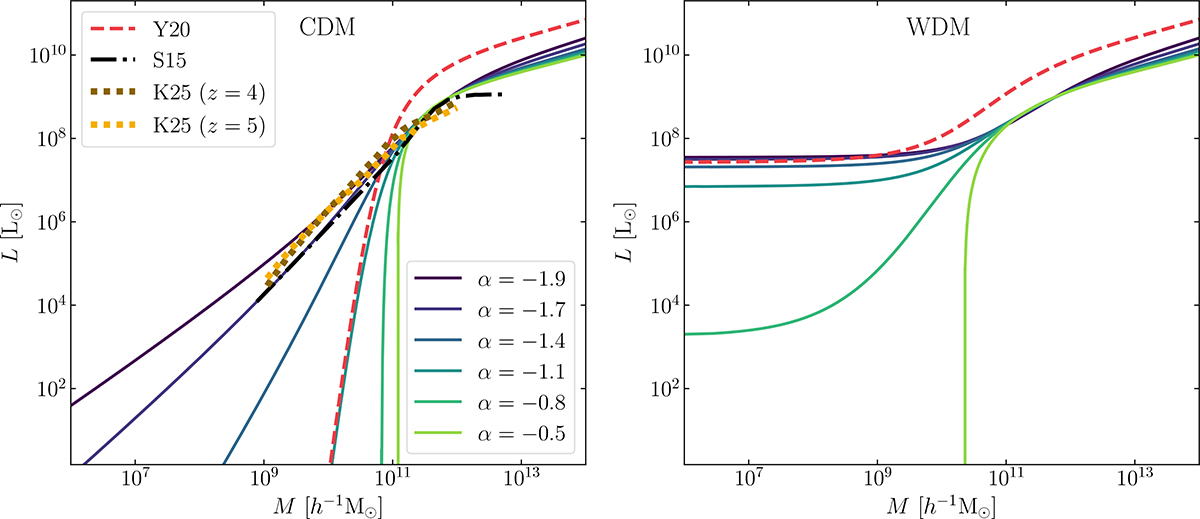
[C II] luminosity–halo mass relation inferred from abundance matching. In both panels, the solid lines correspond to the L(M) relations derived from our Schechter fits to the ALPINE data with fixed values for α. The dashed red line is based on the fit by Yan et al. (2020, Y20). The left and right panels assume a CDM and a 0.5 keV HMF, respectively (see Appendix A for a direct comparison between the two scenarios). In the left panel, for comparison, the dot-dashed black line indicates the L(M) relation obtained by Silva et al. (2015, S15), while the dotted gold and dark gold lines show results from the MARIGOLD simulations (Khatri et al. 2025, K25) at z = 5 and z = 4, respectively.
Current usage metrics show cumulative count of Article Views (full-text article views including HTML views, PDF and ePub downloads, according to the available data) and Abstracts Views on Vision4Press platform.
Data correspond to usage on the plateform after 2015. The current usage metrics is available 48-96 hours after online publication and is updated daily on week days.
Initial download of the metrics may take a while.