Fig. A.1.
Download original image
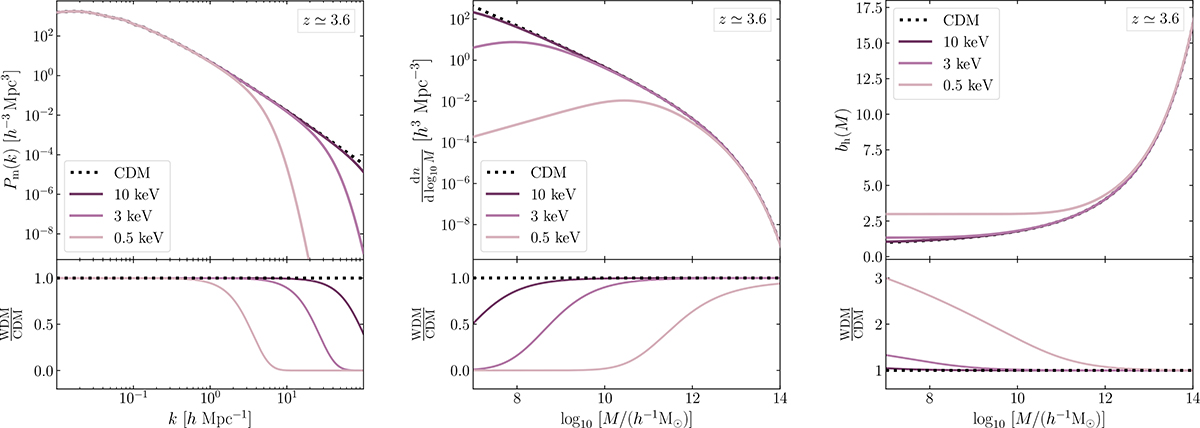
Comparison between CDM and WDM models at z ≃ 3.6. Top panels: matter PS (left), HMF (centre), halo bias (right). The dotted black line corresponds to CDM, while the coloured lines represent WDM models with three representative particle masses. Bottom panels: Ratio of WDM to CDM, illustrating the deviation of each WDM model from the CDM baseline.
Current usage metrics show cumulative count of Article Views (full-text article views including HTML views, PDF and ePub downloads, according to the available data) and Abstracts Views on Vision4Press platform.
Data correspond to usage on the plateform after 2015. The current usage metrics is available 48-96 hours after online publication and is updated daily on week days.
Initial download of the metrics may take a while.