Fig. 3.
Download original image
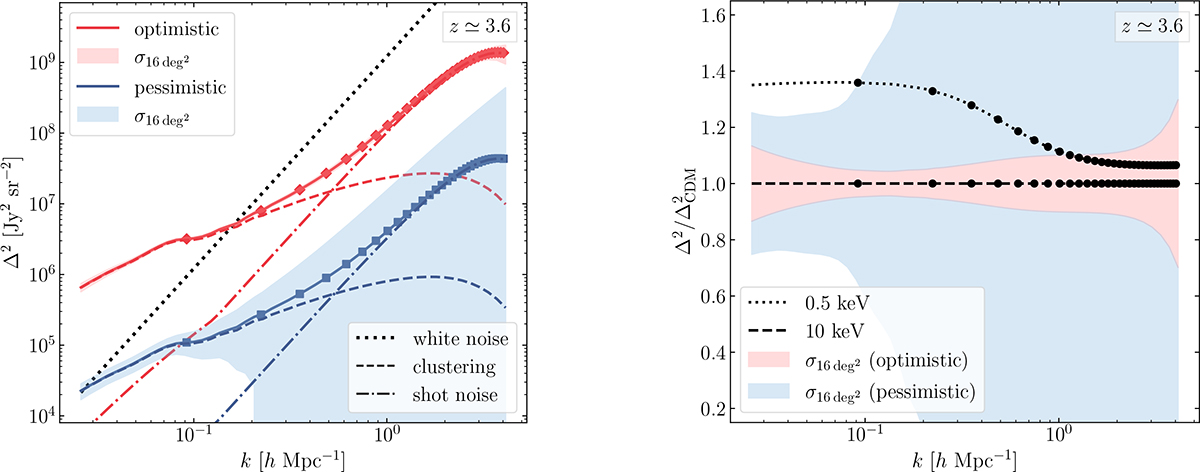
Predicted [C II] PS. Left: Δ2(k, z ≃ 3.6) computed in the CDM scenario for our optimistic (solid red line) and pessimistic (solid blue line) cases for α = −1.1. The shaded areas represent the associated statistical uncertainty as for our survey reference setup. The dotted line is a graphical representation of the white-noise level, PWN, while the dashed and dot-dashed lines refer to the clustering and shot-noise components, respectively. Right: ratio between the WDM and CDM power spectra. The dashed and dotted black lines correspond to WDM models with mWDM = 10 keV and 0.5 keV, respectively. The shaded regions reflect the CDM uncertainties from the left panel. In both panels, the markers illustrate the adopted binning scheme.
Current usage metrics show cumulative count of Article Views (full-text article views including HTML views, PDF and ePub downloads, according to the available data) and Abstracts Views on Vision4Press platform.
Data correspond to usage on the plateform after 2015. The current usage metrics is available 48-96 hours after online publication and is updated daily on week days.
Initial download of the metrics may take a while.