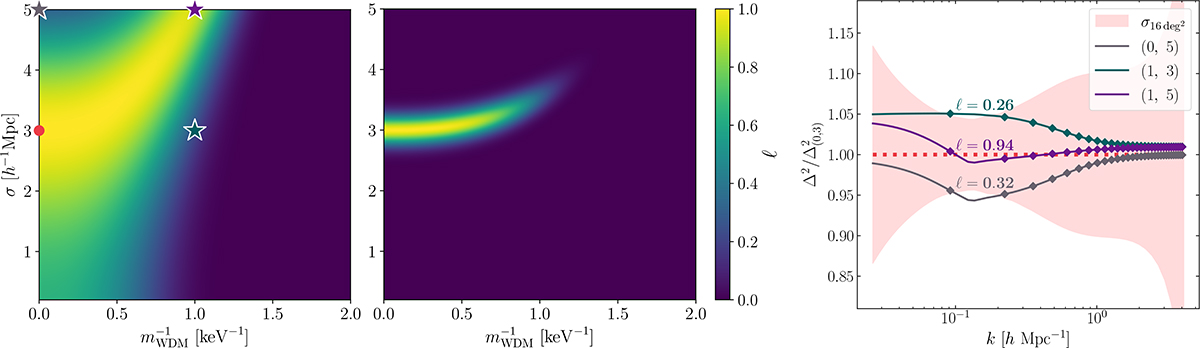
Fig. 4.
Download original image
Likelihood ratio ℓ computed for the optimistic case. Left: ℓ in the reference setup. Centre: Same as the left panel, but with R = 500. Right: Graphical explanation of the banana-shaped ℓ shown in the left panel. Each pair of values (w, σ) in the legend indicates the inverse particle mass in keV−1 and the RSD displacement parameter in units of h−1 Mpc, respectively. The stars of corresponding colours in the left panel serve as identifiers for each combination in the parameter space, while the red circle denotes the true values used to generate the data.
Current usage metrics show cumulative count of Article Views (full-text article views including HTML views, PDF and ePub downloads, according to the available data) and Abstracts Views on Vision4Press platform.
Data correspond to usage on the plateform after 2015. The current usage metrics is available 48-96 hours after online publication and is updated daily on week days.
Initial download of the metrics may take a while.