Fig. 5.
Download original image
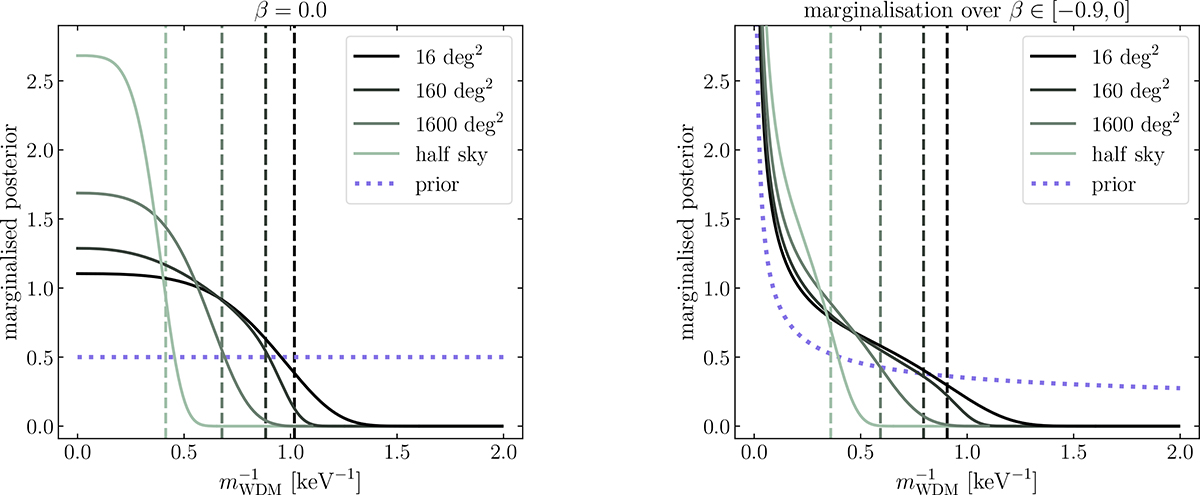
Marginalised posterior (over σ) computed for the whole set of sky areas in the optimistic scenario, with R = 100 and PWN ≃ 2.4 × 10¹⁰ h−3 Mpc3 Jy2 sr−2. Left: Posterior for a fixed β = 0 (uniform prior in w). Right: Result marginalised over β. The dashed lines of corresponding colours indicate the mWDM threshold up to which CDM and WDM can be distinguished (95% CL). The dotted lines show the assumed prior distribution for w.
Current usage metrics show cumulative count of Article Views (full-text article views including HTML views, PDF and ePub downloads, according to the available data) and Abstracts Views on Vision4Press platform.
Data correspond to usage on the plateform after 2015. The current usage metrics is available 48-96 hours after online publication and is updated daily on week days.
Initial download of the metrics may take a while.