Fig. 6.
Download original image
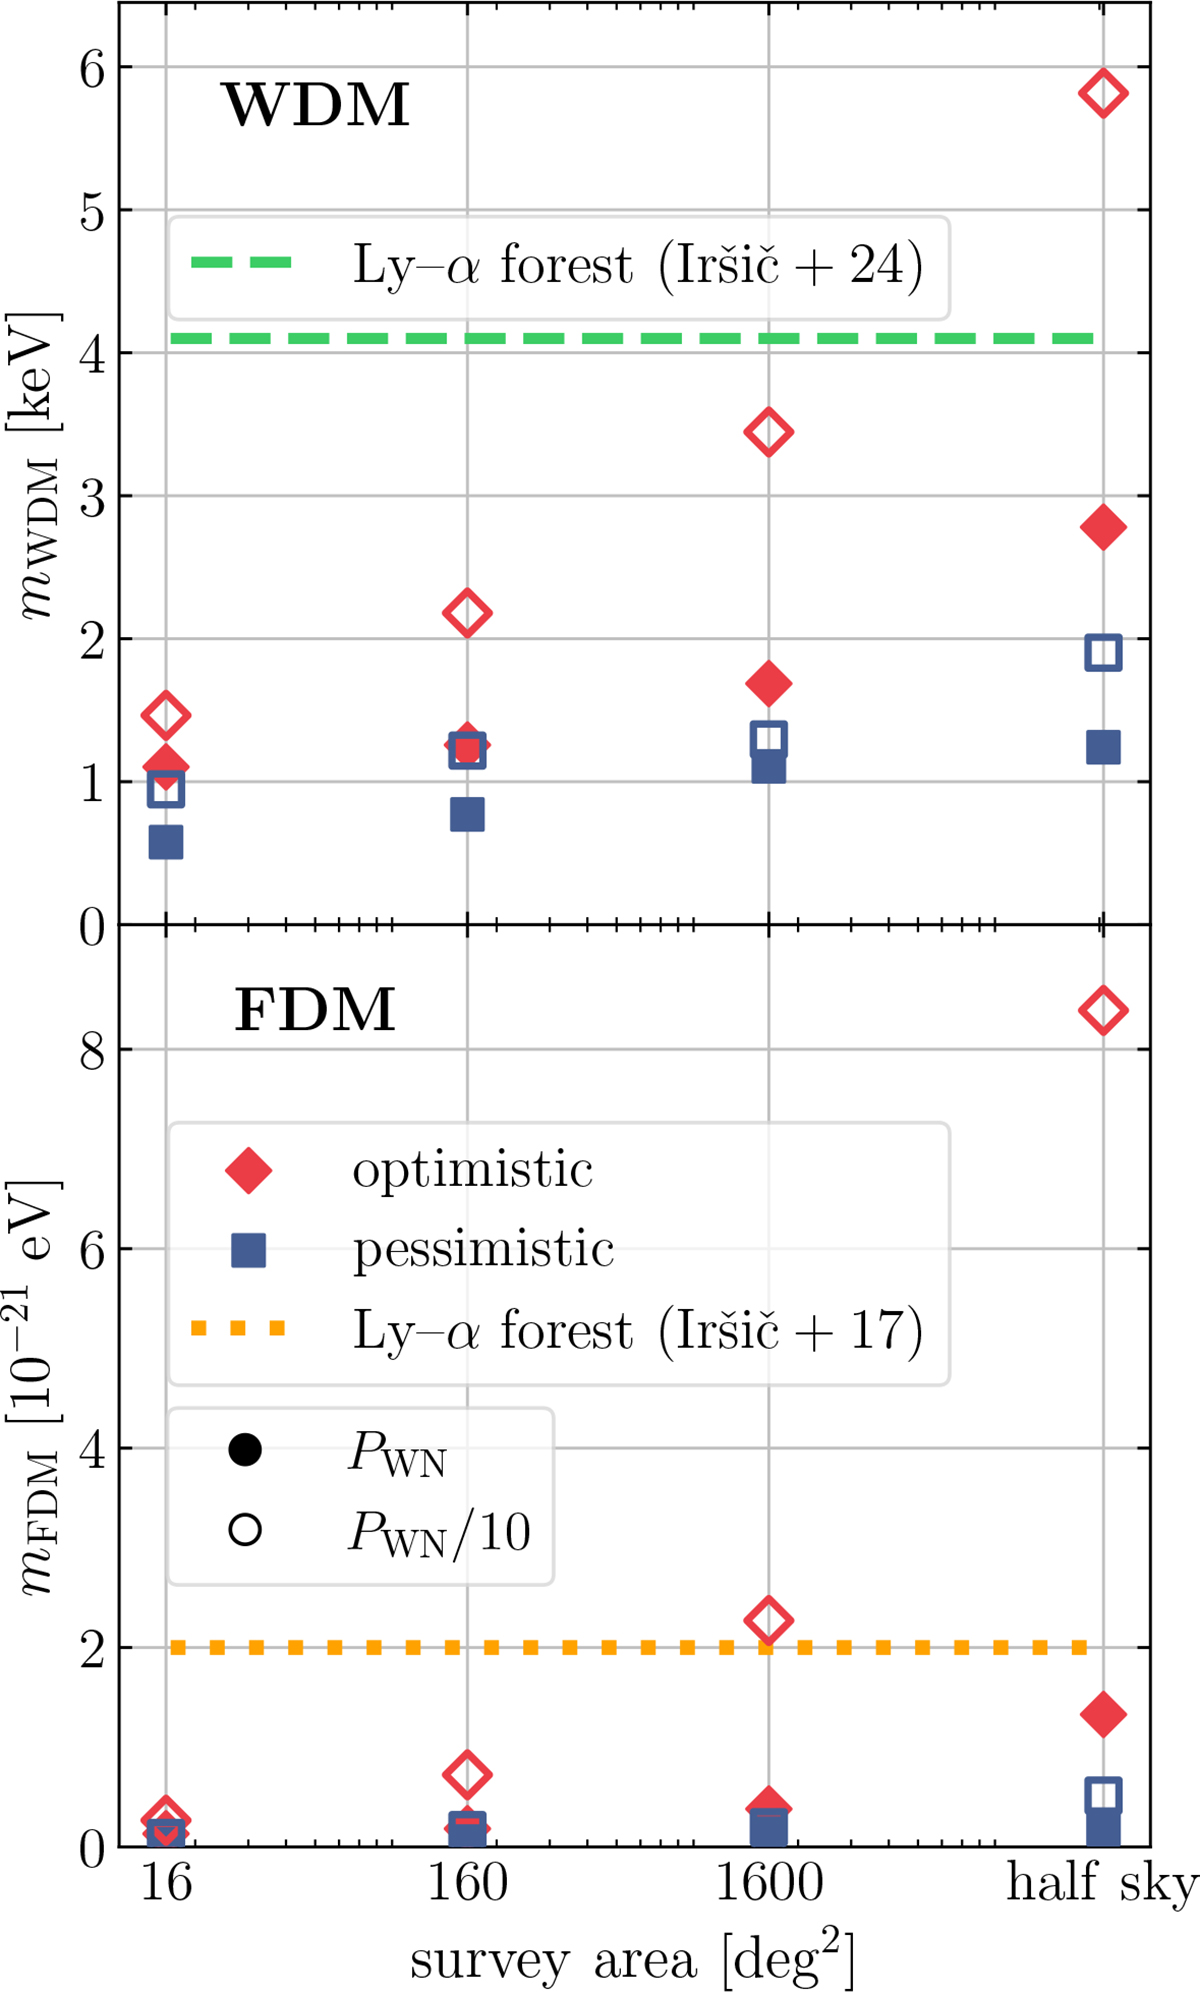
Lower bounds on mWDM (top) and mFDM (bottom) for R = 100. The pessimistic case is represented by the blue squares, while the optimistic case is denoted by the red diamonds. Filled markers correspond to the reference sensitivity; empty markers indicate a sensitivity increased by a factor of ![]() (i.e. a white-noise PS decreased by a factor of ten). Shown for reference are the dashed green and dotted orange lines, marking the lower bounds inferred by Iršič et al. (2024) and Iršič et al. (2017a), respectively.
(i.e. a white-noise PS decreased by a factor of ten). Shown for reference are the dashed green and dotted orange lines, marking the lower bounds inferred by Iršič et al. (2024) and Iršič et al. (2017a), respectively.
Current usage metrics show cumulative count of Article Views (full-text article views including HTML views, PDF and ePub downloads, according to the available data) and Abstracts Views on Vision4Press platform.
Data correspond to usage on the plateform after 2015. The current usage metrics is available 48-96 hours after online publication and is updated daily on week days.
Initial download of the metrics may take a while.