Open Access
Fig. 7.
Download original image
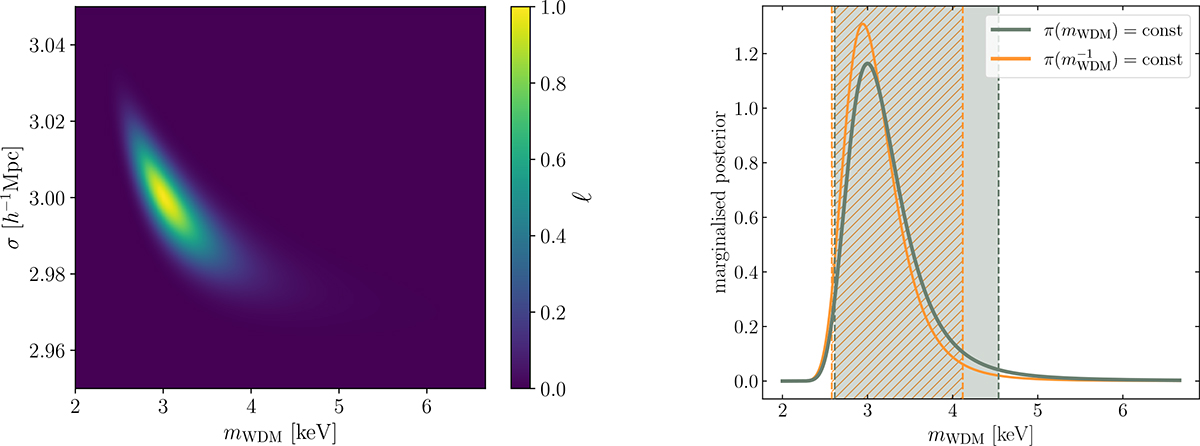
Likelihood ratio ℓ (left) and marginalised posterior (right) obtained from 3 keV mock data in the optimistic scenario for a survey covering 1600 deg2 with R = 500 and ![]() . In the right panel, the dark-green and orange vertical lines denote the 95% credible regions, computed assuming uniform priors in mWDM and
. In the right panel, the dark-green and orange vertical lines denote the 95% credible regions, computed assuming uniform priors in mWDM and ![]() , respectively.
, respectively.
Current usage metrics show cumulative count of Article Views (full-text article views including HTML views, PDF and ePub downloads, according to the available data) and Abstracts Views on Vision4Press platform.
Data correspond to usage on the plateform after 2015. The current usage metrics is available 48-96 hours after online publication and is updated daily on week days.
Initial download of the metrics may take a while.