Open Access
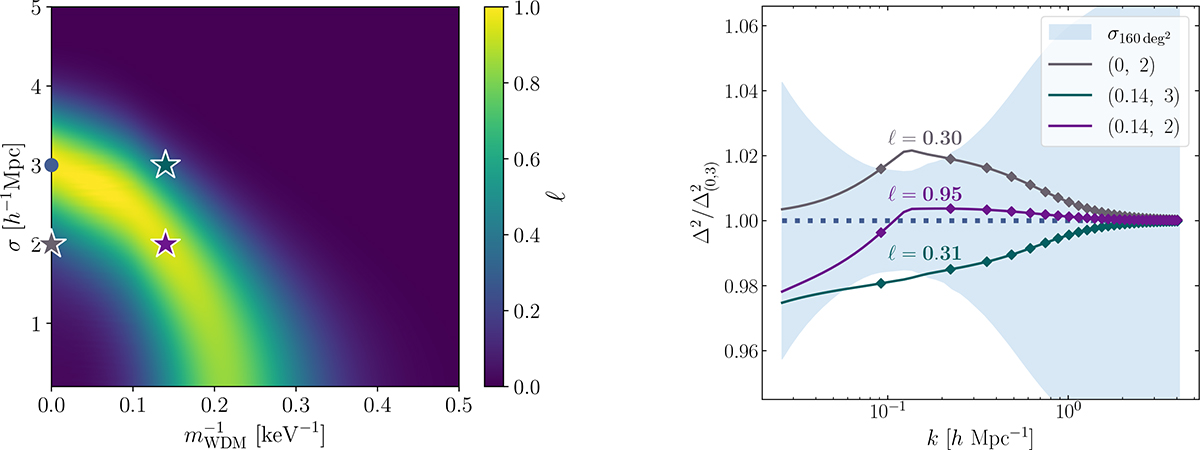
Fig. 9.
Download original image
Likelihood ratio ℓ computed for the pessimistic case with α = −1.9 in a convenient setup (R = 100, 160 deg2, and PWN ≃ 2.4 × 10⁹ h−3 Mpc3 Jy2 sr−2) to highlight its reversed shape in the parameter space. The left and right panels are related in the same way as in Fig. 4.
Current usage metrics show cumulative count of Article Views (full-text article views including HTML views, PDF and ePub downloads, according to the available data) and Abstracts Views on Vision4Press platform.
Data correspond to usage on the plateform after 2015. The current usage metrics is available 48-96 hours after online publication and is updated daily on week days.
Initial download of the metrics may take a while.