Fig. 4
Download original image
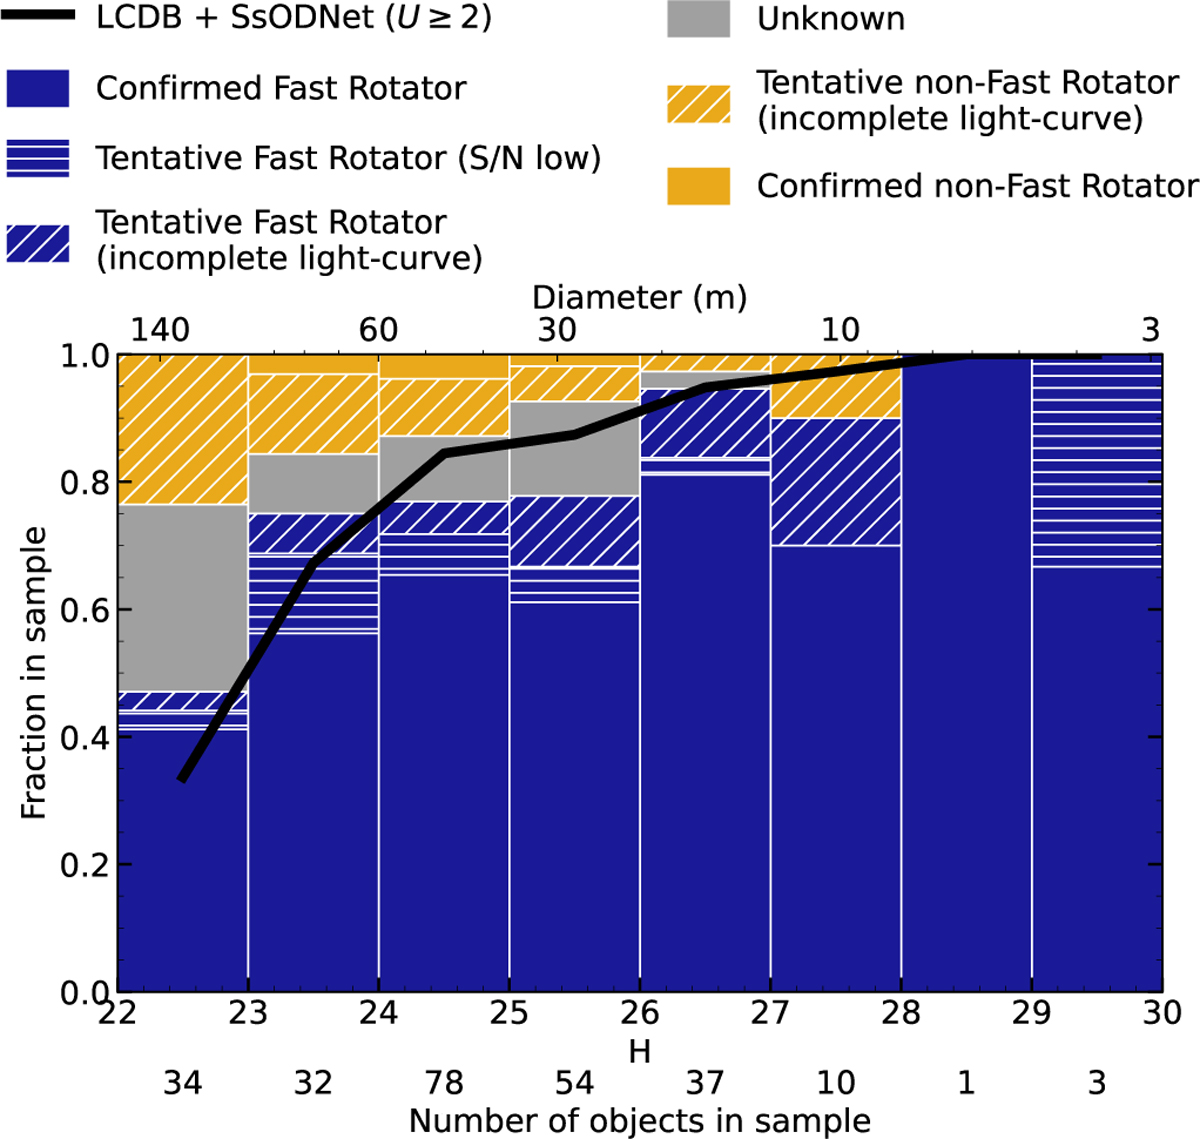
Histogram showing how the objects in our survey distribute by rotational classification as a function of absolute magnitude H. The blue bars indicate confirmed or tentative fast rotators, the orange bars show non-fast rotators, and the grey bars represent objects with insufficient information to determine their rotation state. The bottom horizontal axis displays the number of targets observed in each magnitude bin, whereas the top axis provides the corresponding diameter scale computed assuming an albedo of 0.15. The black line shows the fast-rotator fractions obtained from the LCDB and SsODNet (U ≥ 2), allowing a direct comparison with our sample.
Current usage metrics show cumulative count of Article Views (full-text article views including HTML views, PDF and ePub downloads, according to the available data) and Abstracts Views on Vision4Press platform.
Data correspond to usage on the plateform after 2015. The current usage metrics is available 48-96 hours after online publication and is updated daily on week days.
Initial download of the metrics may take a while.