Fig. 5
Download original image
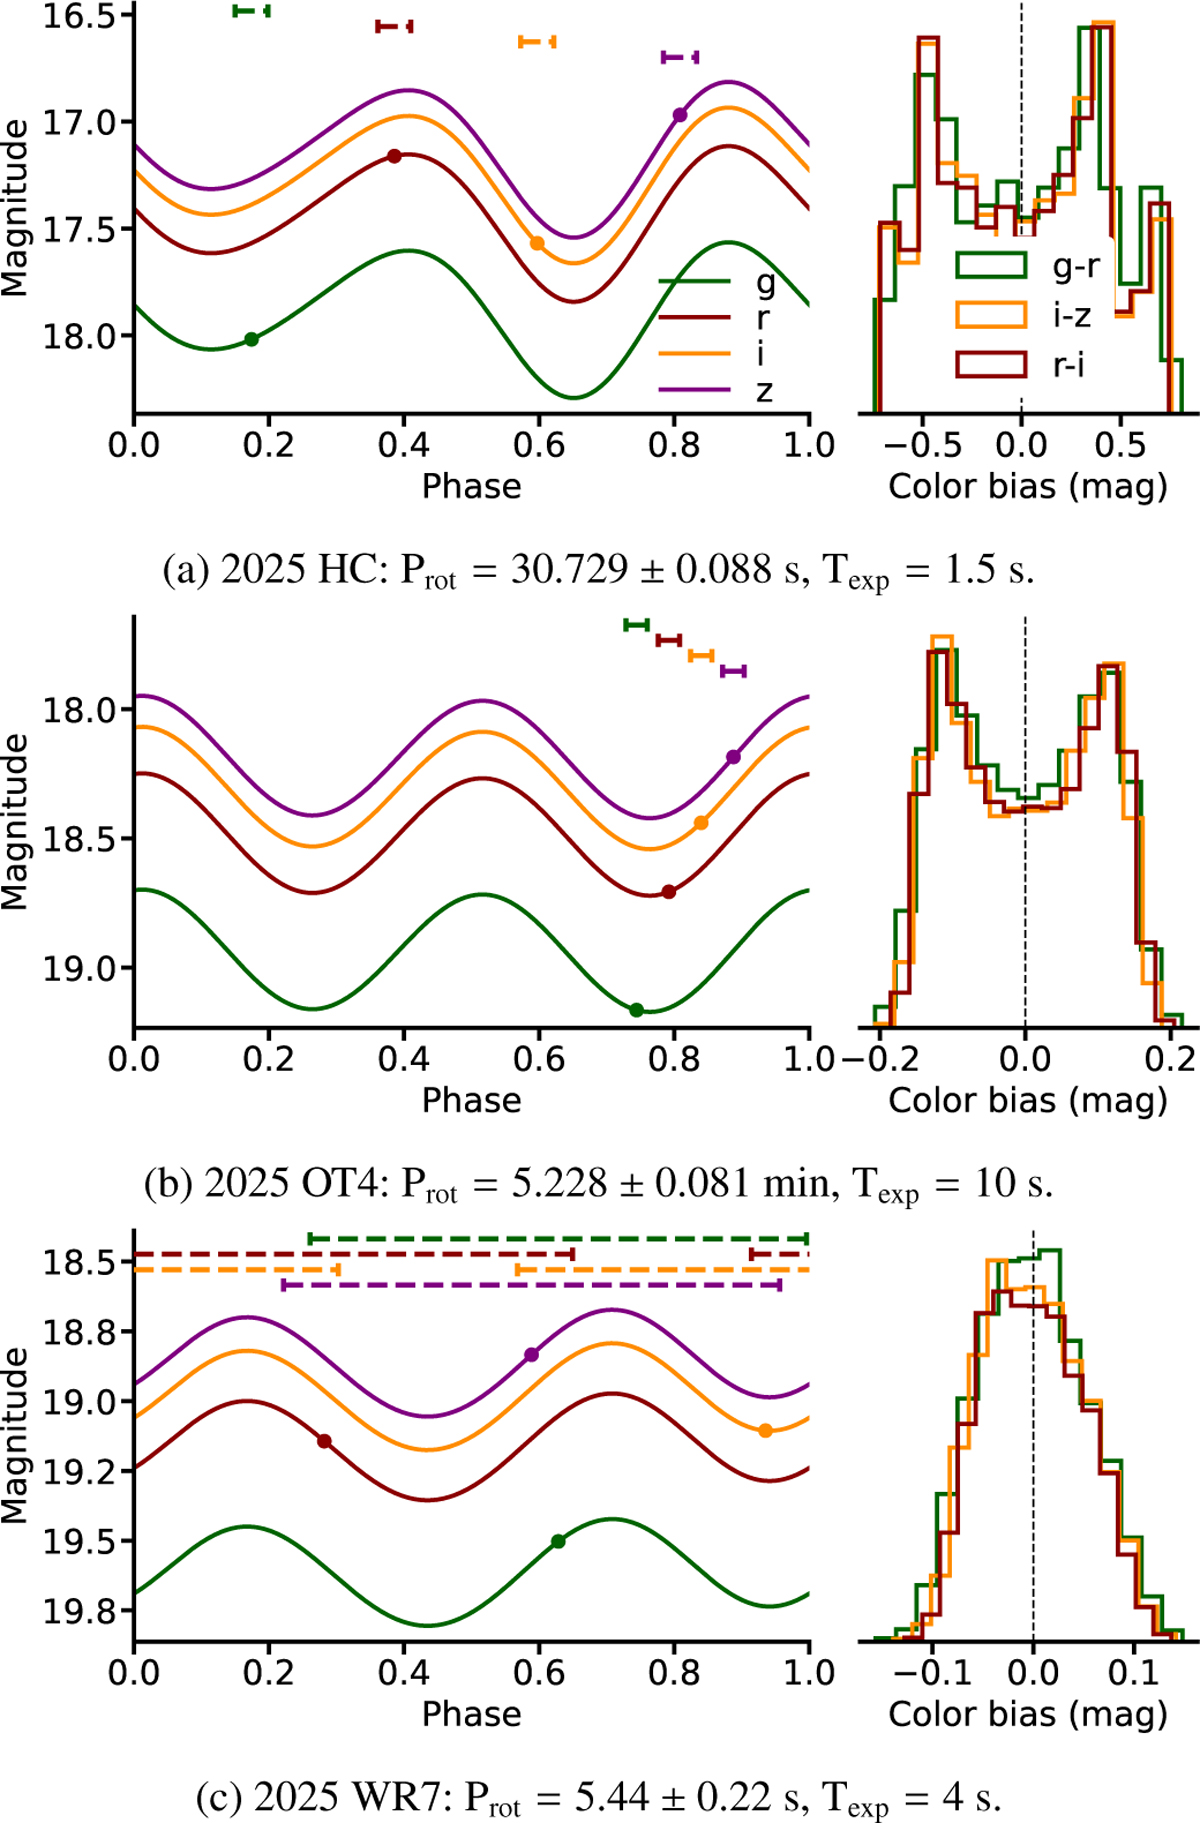
Synthetic light curve models in the g, r, i, and z bands are shown for three representative fast-rotating near-Earth asteroids. The left panel shows the per filter rotational models with an example of multi-filter observing cycle, supposing an inter-image overhead of 5 s; the exposure windows in rotational phase are indicated at the top of the panel by two vertical markers delimiting the start and end of each exposure, connected by a dashed line, while the circles mark the phase centres. The right panel shows the distribution of the colour bias (magX − magY)meas − (magX − magY)true for 5000 random realisations of this sequence. The underlying true colours are assumed to be (g − r) = 0.45, (r − i) = 0.18, and (i − z) = 0.12; these values are illustrative and only set the absolute colour scale, without affecting the shape of the bias distributions. The histograms are plotted with arbitrary normalisation since only the shape of the distributions are relevant.
Current usage metrics show cumulative count of Article Views (full-text article views including HTML views, PDF and ePub downloads, according to the available data) and Abstracts Views on Vision4Press platform.
Data correspond to usage on the plateform after 2015. The current usage metrics is available 48-96 hours after online publication and is updated daily on week days.
Initial download of the metrics may take a while.