Fig. 1.
Download original image
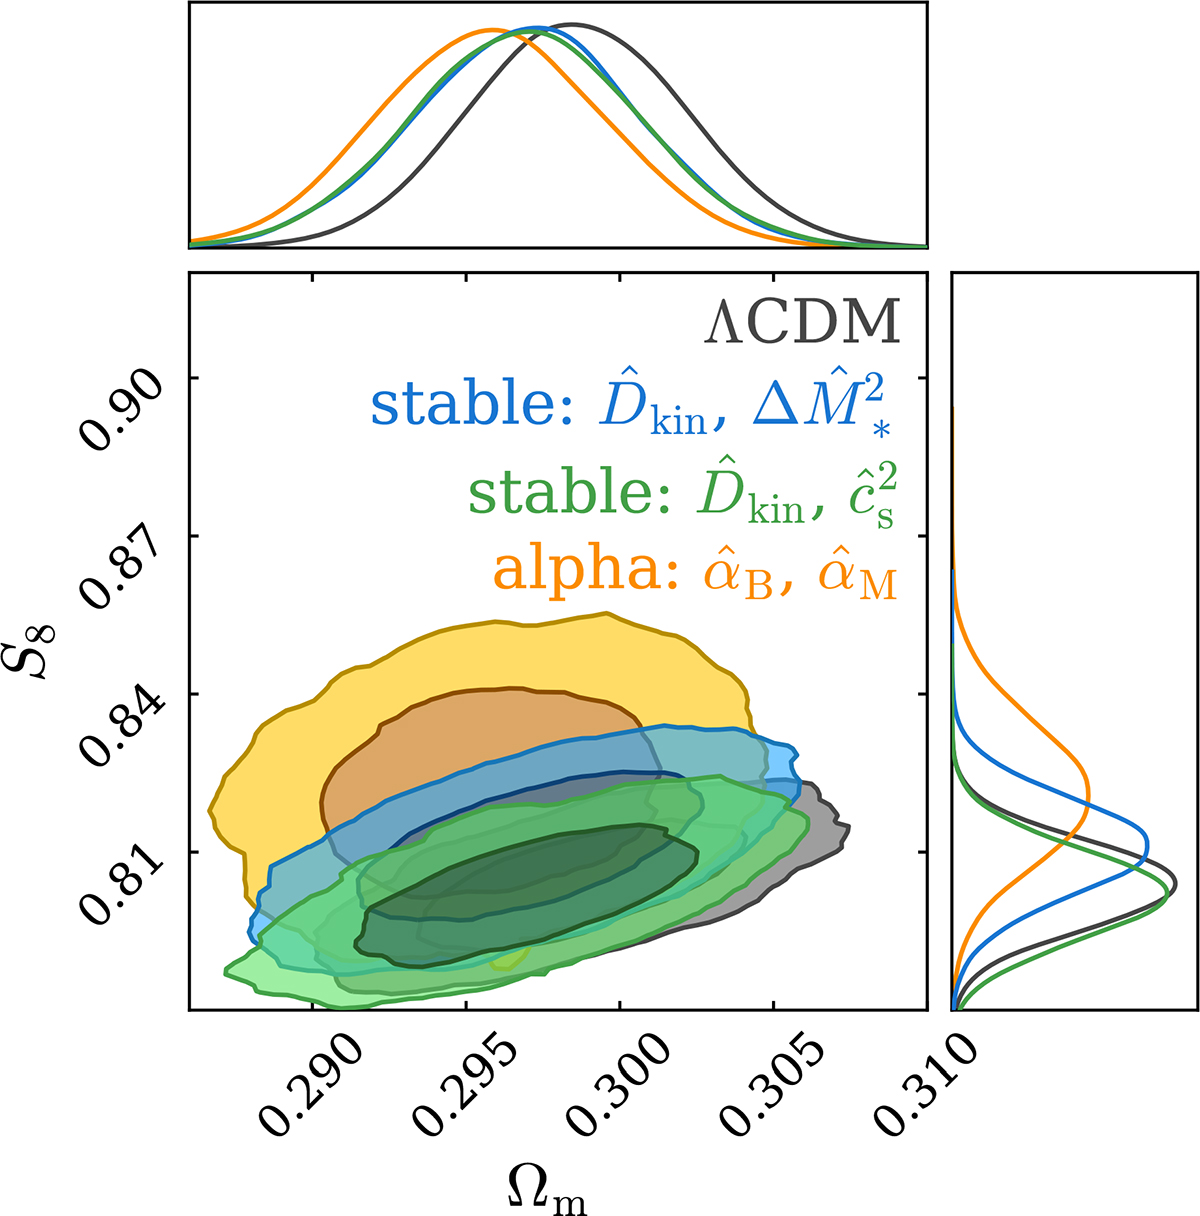
Posterior distribution in the S8-Ωm plane for the combination of KiDS-Legacy, DESI DR2 BAO, eBOSS DR16 RSD, and Planck 2018 TTTEEE, low-ℓ TT, and low-ℓ EE datasets. The blue contours illustrate the posterior inferred in a Horndeski model parametrised by the stable basis parameters ![]() and
and ![]() , and the green contour shows constraints from sampling
, and the green contour shows constraints from sampling ![]() and
and ![]() . The orange contour shows the posterior in a Horndeski model using the
. The orange contour shows the posterior in a Horndeski model using the ![]() -
-![]() parametrisation. The black contour corresponds to the fiducial ΛCDM analysis. The inner and outer contours of the marginalised posteriors correspond to the 68% and 95% credible intervals, respectively.
parametrisation. The black contour corresponds to the fiducial ΛCDM analysis. The inner and outer contours of the marginalised posteriors correspond to the 68% and 95% credible intervals, respectively.
Current usage metrics show cumulative count of Article Views (full-text article views including HTML views, PDF and ePub downloads, according to the available data) and Abstracts Views on Vision4Press platform.
Data correspond to usage on the plateform after 2015. The current usage metrics is available 48-96 hours after online publication and is updated daily on week days.
Initial download of the metrics may take a while.