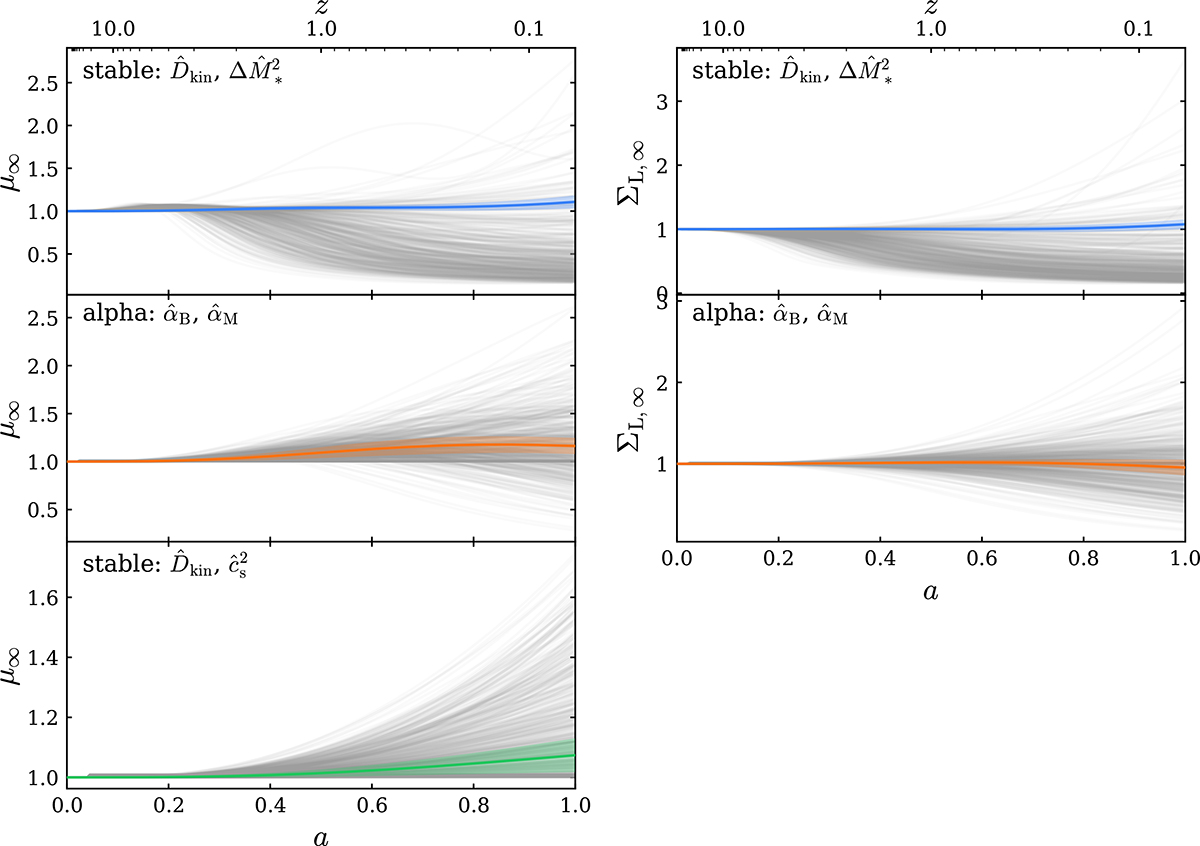
Fig. C.2.
Download original image
Prior distribution of the effective Newtonian coupling, μ∞, and the lensing modification, ΣL, ∞, generated by drawing 500 samples from the prior, given in Table 1. Each line illustrates the evolution of μ∞ and ΣL, ∞ as a function of scale factor for one set of parameters generated from the prior. Additionally the coloured lines and shaded regions show the corresponding posterior distribution inferred from the combination of KiDS-Legacy, DESI DR2 BAO, eBOSS DR16 RSD, and Planck 2018 TTTEEE, low-ℓ TT, and low-ℓ EE datasets. The three rows show the stable basis parametrised by ![]() and
and ![]() , the direct sampling of
, the direct sampling of ![]() and
and ![]() , and the stable basis parametrised by
, and the stable basis parametrised by ![]() and
and ![]() , respectively.
, respectively.
Current usage metrics show cumulative count of Article Views (full-text article views including HTML views, PDF and ePub downloads, according to the available data) and Abstracts Views on Vision4Press platform.
Data correspond to usage on the plateform after 2015. The current usage metrics is available 48-96 hours after online publication and is updated daily on week days.
Initial download of the metrics may take a while.