Fig. 5.
Download original image
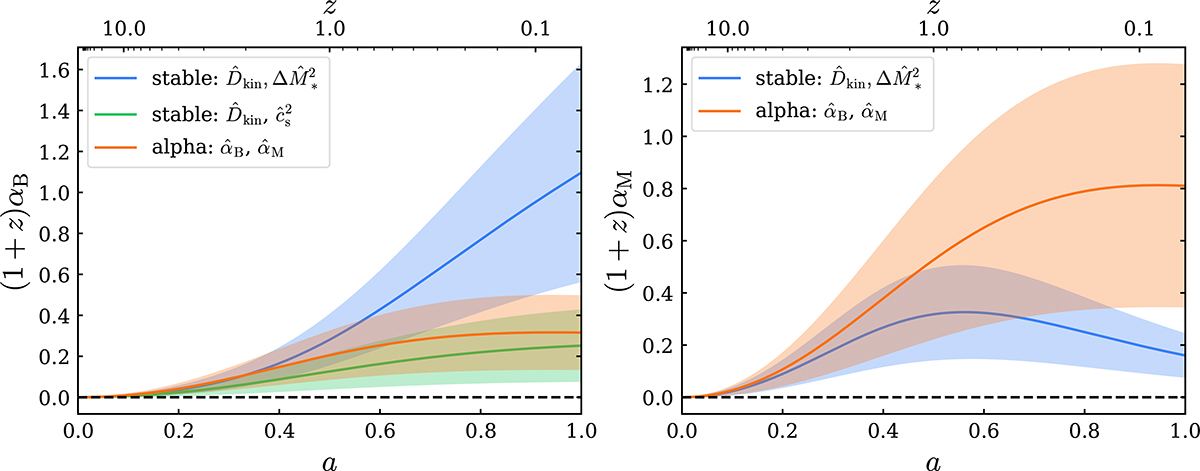
Constraints on αB (left) and αM (right) as a function of scale factor for the combination of KiDS-Legacy, DESI DR2 BAO, eBOSS DR16 RSD, and Planck 2018 TTTEEE, low-ℓ TT, and low-ℓ EE datasets. The blue contour results from the analysis with Horndeski gravity modelled by the stable parameter basis ![]() and
and ![]() and the orange contour corresponds to a direct sampling of
and the orange contour corresponds to a direct sampling of ![]() and
and ![]() with αB(a) and αM(a) proportional to the dark energy density, following Eq. (6). The green contour shows the derived constraint on αB when sampling
with αB(a) and αM(a) proportional to the dark energy density, following Eq. (6). The green contour shows the derived constraint on αB when sampling ![]() and
and ![]() for a fixed Planck mass and therefore imposing αM = 0. The solid line shows the mean of the posterior and the shaded region illustrates the 68% credible interval. The prior distributions of αB and αM for each model are displayed in Fig. C.1.
for a fixed Planck mass and therefore imposing αM = 0. The solid line shows the mean of the posterior and the shaded region illustrates the 68% credible interval. The prior distributions of αB and αM for each model are displayed in Fig. C.1.
Current usage metrics show cumulative count of Article Views (full-text article views including HTML views, PDF and ePub downloads, according to the available data) and Abstracts Views on Vision4Press platform.
Data correspond to usage on the plateform after 2015. The current usage metrics is available 48-96 hours after online publication and is updated daily on week days.
Initial download of the metrics may take a while.