Fig. 6.
Download original image
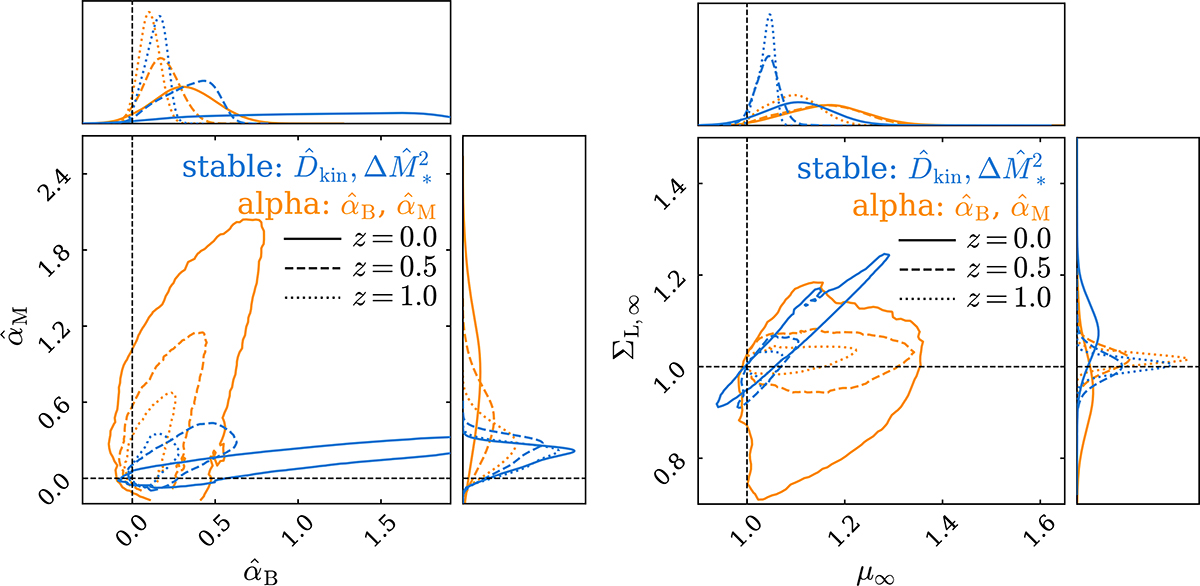
Posterior distribution of the derived αB and αM (left) and the effective Newtonian coupling μ∞ and the lensing modification ΣL, ∞ (right) at three distinct redshifts. Each posterior is derived from the combination of KiDS-Legacy, DESI DR2 BAO, eBOSS DR16 RSD, and Planck 2018 TTTEEE, low-ℓ TT, and low-ℓ EE datasets. The blue contours are inferred with Horndeski gravity modelled by the stable parameter basis ![]() and
and ![]() and the orange contours corresponds to a direct sampling of
and the orange contours corresponds to a direct sampling of ![]() and
and ![]() with αB(a) and αM(a) proportional to the dark energy density, following Eq. (6). The black dashed lines indicate the GR limit set by αB = αM = 0 and μ∞ = ΣL, ∞ = 1. Each contour shows the 95% credible interval.
with αB(a) and αM(a) proportional to the dark energy density, following Eq. (6). The black dashed lines indicate the GR limit set by αB = αM = 0 and μ∞ = ΣL, ∞ = 1. Each contour shows the 95% credible interval.
Current usage metrics show cumulative count of Article Views (full-text article views including HTML views, PDF and ePub downloads, according to the available data) and Abstracts Views on Vision4Press platform.
Data correspond to usage on the plateform after 2015. The current usage metrics is available 48-96 hours after online publication and is updated daily on week days.
Initial download of the metrics may take a while.