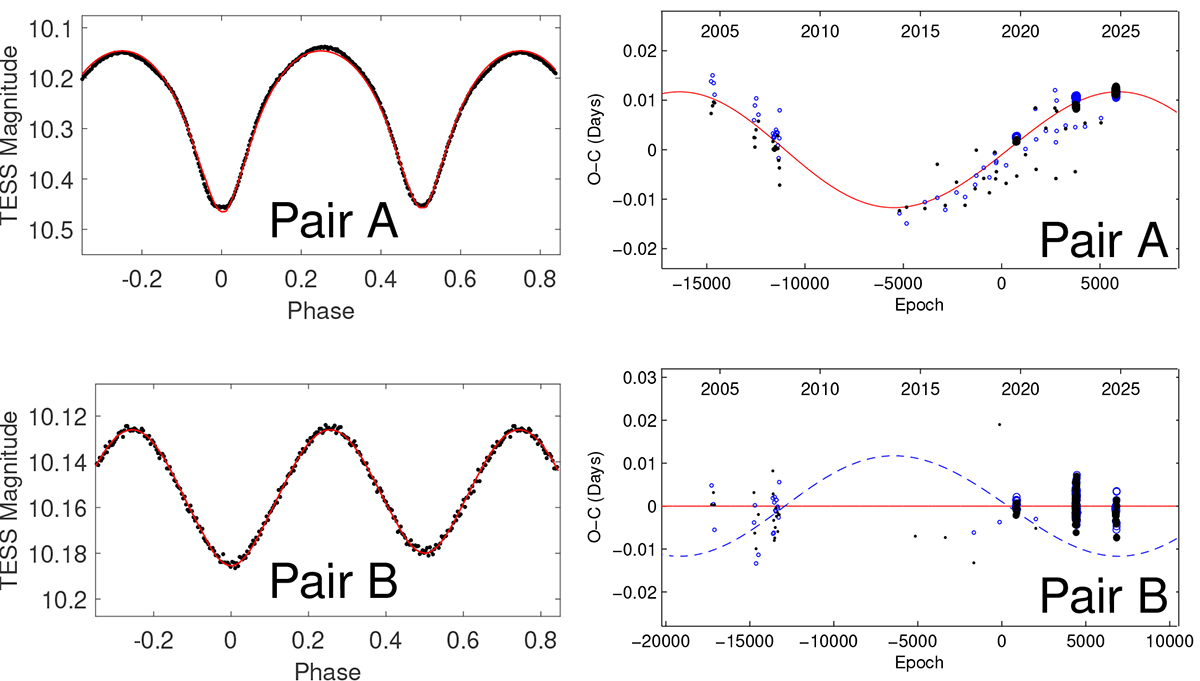
Fig. 1.
Download original image
Analysis of the system V736 And. Left: Light curves of pairs A and B from the TESS satellite. Right: ETV analysis of both pairs, with all the data collected for the star from various surveys. Larger symbols represent data taken with a higher weight because of their better-quality data (e.g. TESS). The filled dots are the primary eclipses; the open circles are for the secondary ones. The solid red curve for pair A stands for the classical light travel time effect fit, while for pair B such a fit with an opposite shape is plotted as a dashed blue line (obviously not fitting the data).
Current usage metrics show cumulative count of Article Views (full-text article views including HTML views, PDF and ePub downloads, according to the available data) and Abstracts Views on Vision4Press platform.
Data correspond to usage on the plateform after 2015. The current usage metrics is available 48-96 hours after online publication and is updated daily on week days.
Initial download of the metrics may take a while.