Open Access
Fig. 3.
Download original image
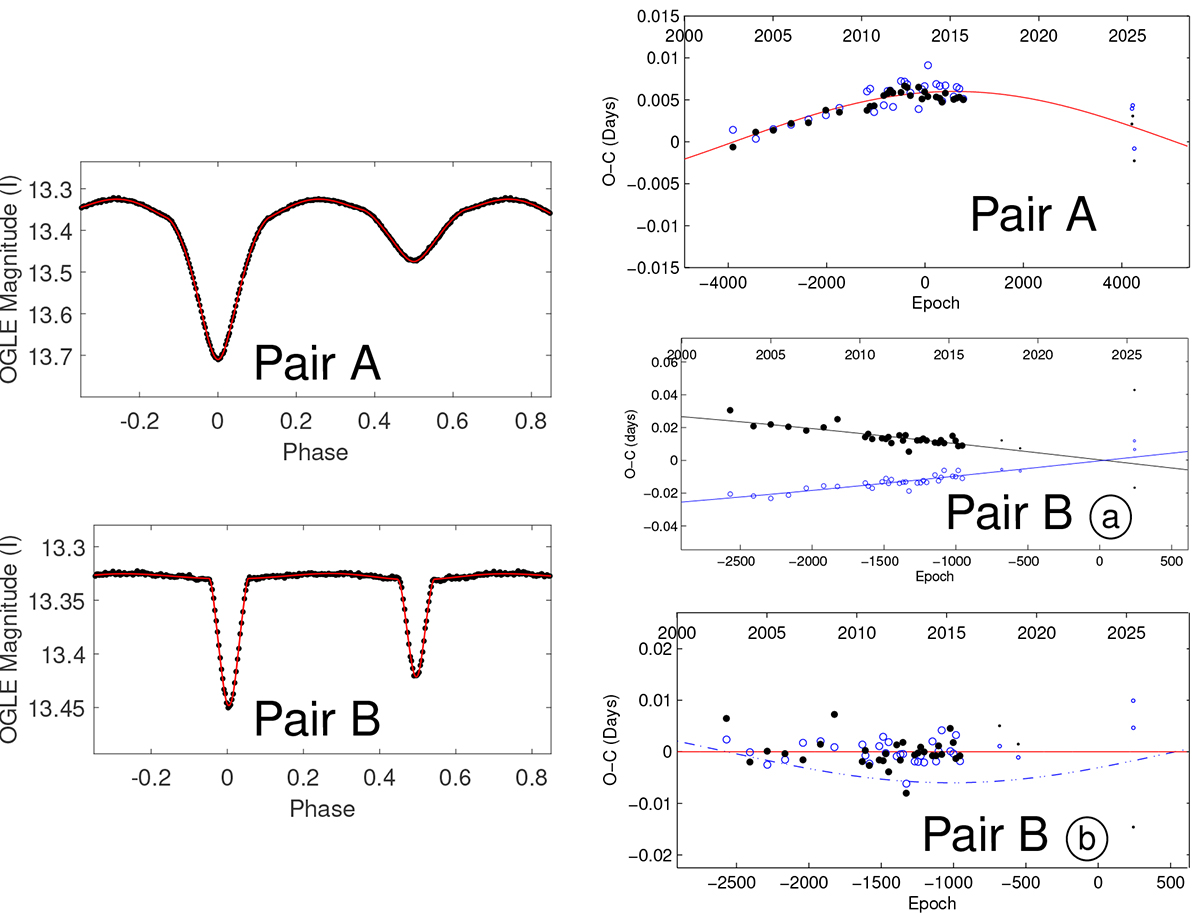
Similar to Fig. 1 but for the system OGLE BLG-ECL-123507. The figures of the A and B pairs are accompanied by the ETV diagram of the slow apsidal motion of pair B (panel &#Xtextcircled;a). Panel &#Xtextcircled;b was plotted after subtraction of the long-term apsidal evolution.
Current usage metrics show cumulative count of Article Views (full-text article views including HTML views, PDF and ePub downloads, according to the available data) and Abstracts Views on Vision4Press platform.
Data correspond to usage on the plateform after 2015. The current usage metrics is available 48-96 hours after online publication and is updated daily on week days.
Initial download of the metrics may take a while.