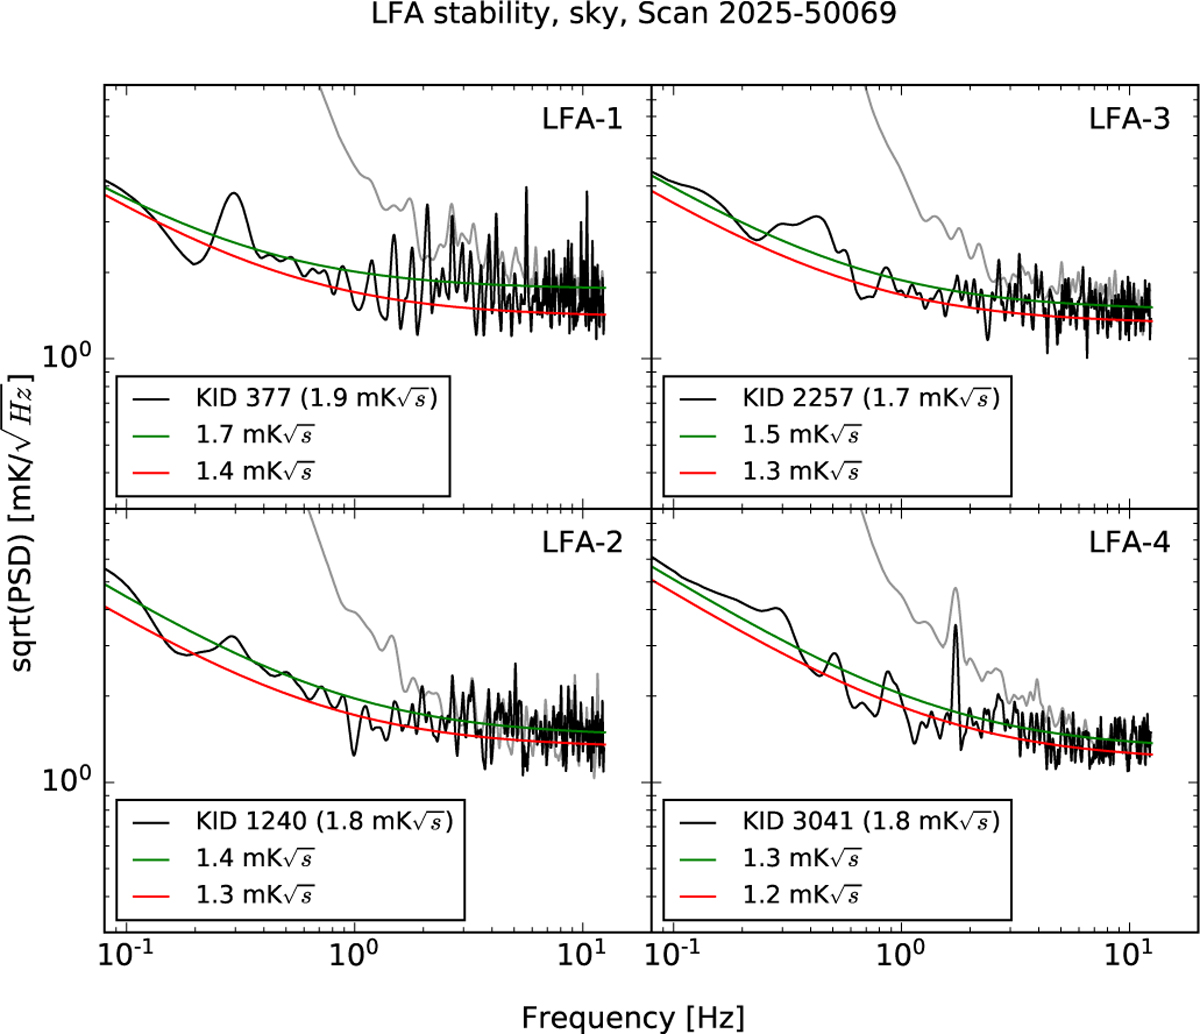
Fig. 12
Download original image
Noise spectra of typical LFA pixels in different readout chains. The data are from a 5-minute integration on a sky position. Gray traces show raw data; black traces show data after atmospheric noise removal. Both traces are smoothed with a 0.1 Hz Gaussian. The green line shows the best-fit to signal, indicating noise level above 2 Hz. The red line shows the estimated detector noise after median filtering of contaminant before data smoothing.
Current usage metrics show cumulative count of Article Views (full-text article views including HTML views, PDF and ePub downloads, according to the available data) and Abstracts Views on Vision4Press platform.
Data correspond to usage on the plateform after 2015. The current usage metrics is available 48-96 hours after online publication and is updated daily on week days.
Initial download of the metrics may take a while.