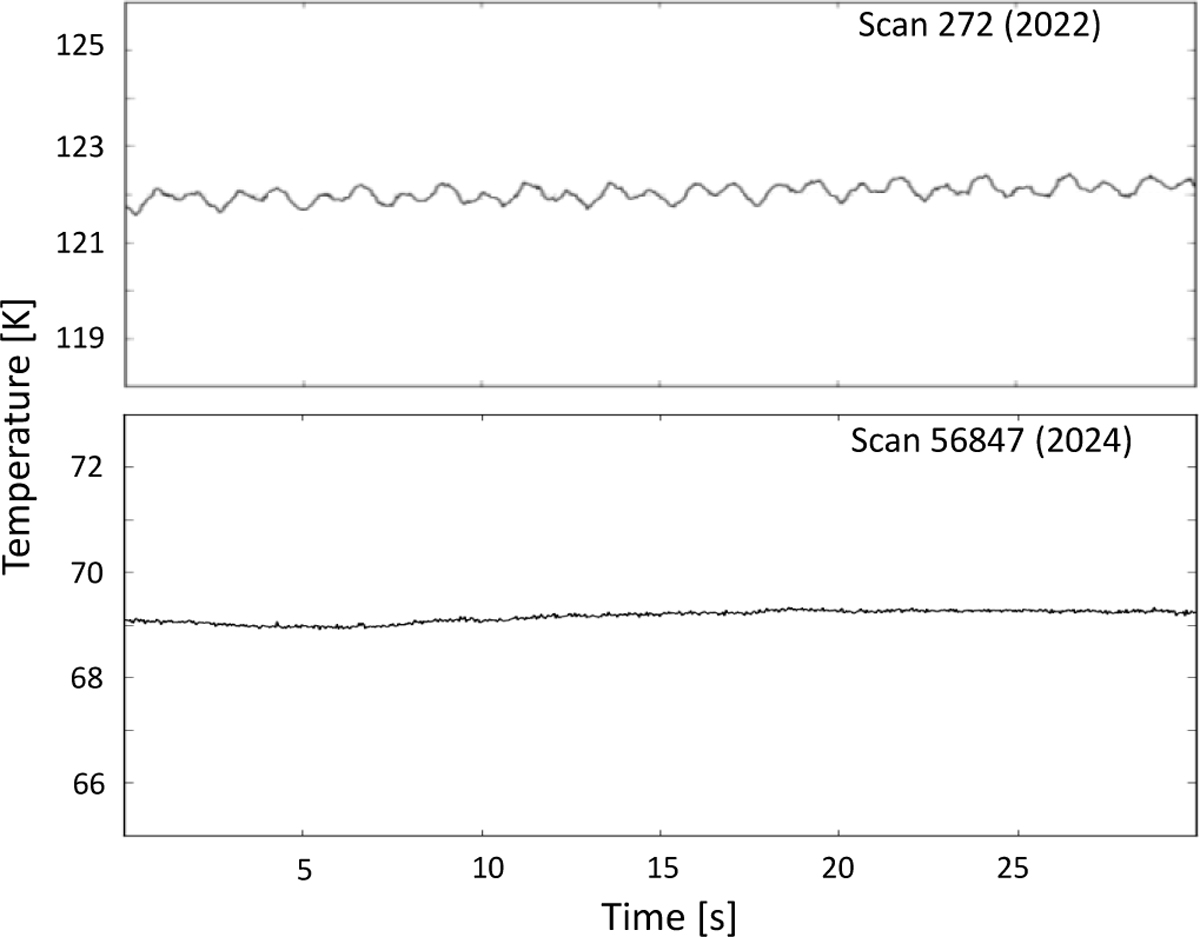
Fig. B.2
Download original image
Top: Typical LFA timeline before the installation of the magnetic shield. Bottom: Timeline taken during instrument commissioning in 2024, i.e., after magnetic shield installation. The strong 0.3 Hz (and harmonics) signal present in the old data is now completely suppressed. The different in temperature level is due to old data being take in laboratory environment using the calibration load; meanwhile, the bottom panel data uses cold sky as background.
Current usage metrics show cumulative count of Article Views (full-text article views including HTML views, PDF and ePub downloads, according to the available data) and Abstracts Views on Vision4Press platform.
Data correspond to usage on the plateform after 2015. The current usage metrics is available 48-96 hours after online publication and is updated daily on week days.
Initial download of the metrics may take a while.