Open Access
Fig. 2
Download original image
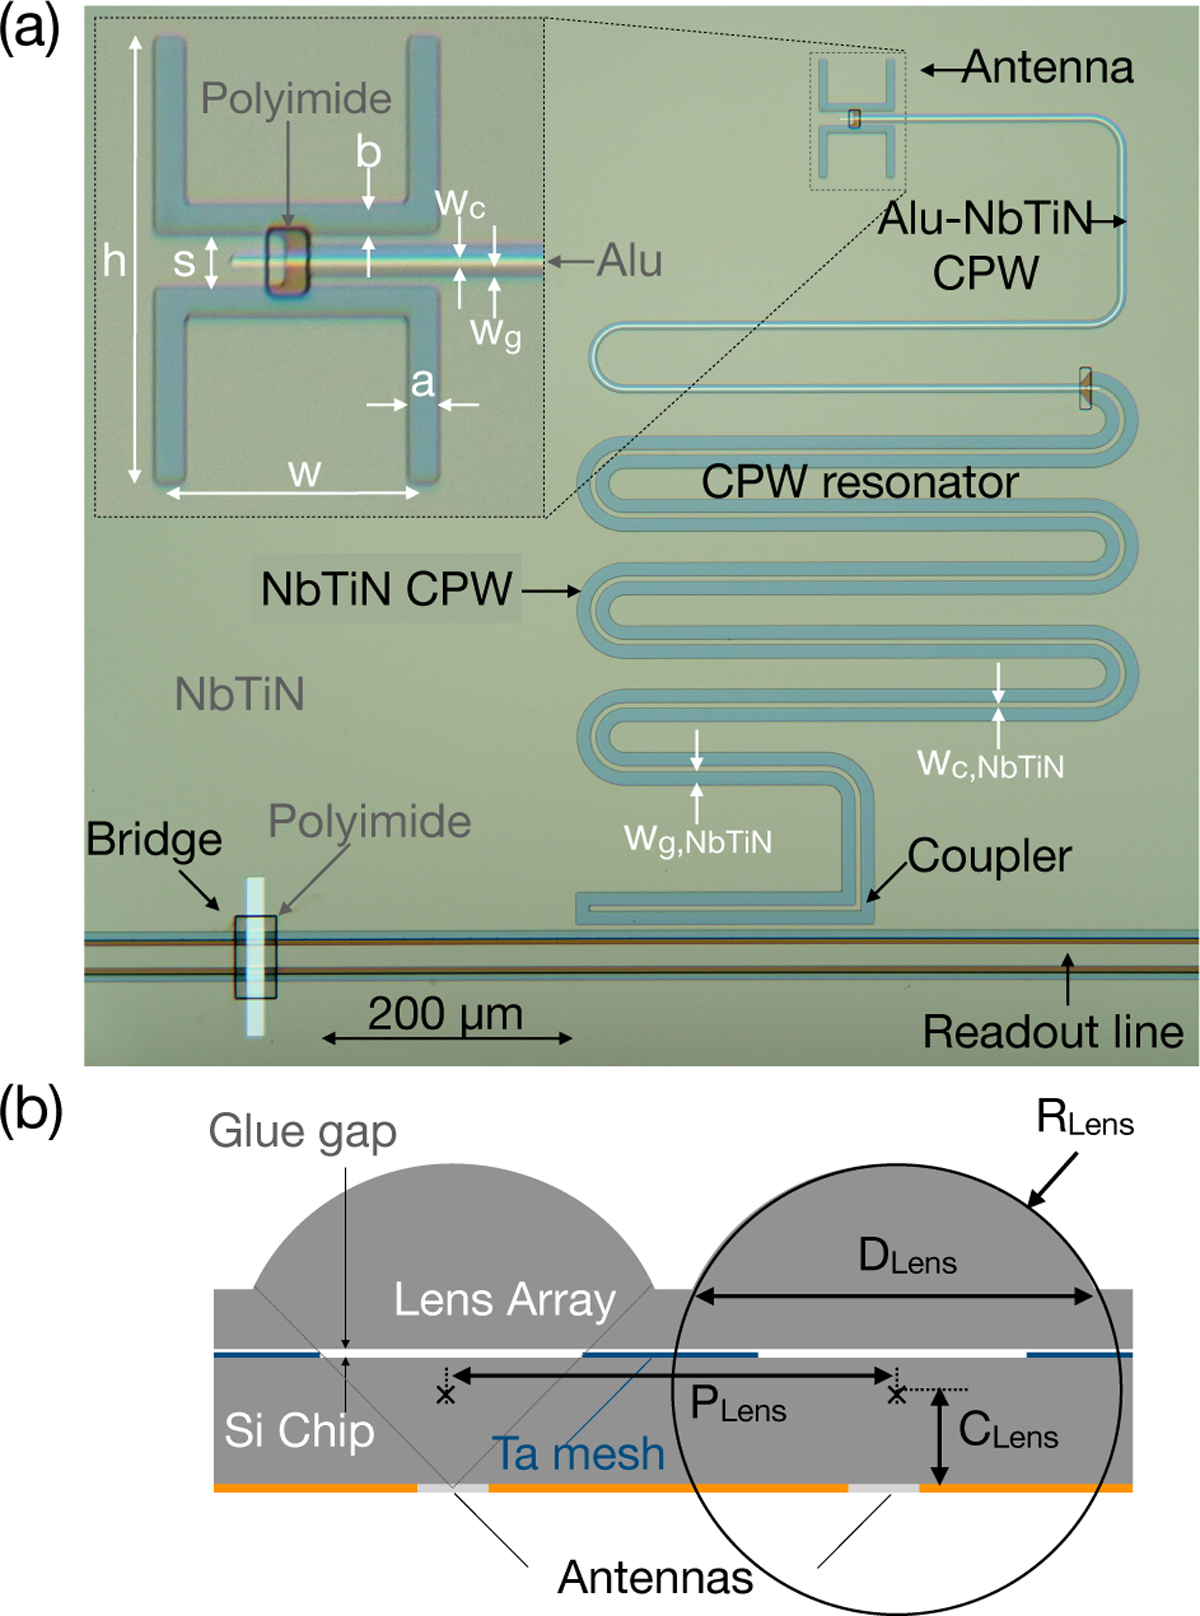
(a) Optical micrograph of a single H band detector with a zoom-in on the antenna structure. (b) Cross section of the chip-lens array assembly. All indicated parameters in panels (a) and (b) are given for both the H band and L band in Table 1.
Current usage metrics show cumulative count of Article Views (full-text article views including HTML views, PDF and ePub downloads, according to the available data) and Abstracts Views on Vision4Press platform.
Data correspond to usage on the plateform after 2015. The current usage metrics is available 48-96 hours after online publication and is updated daily on week days.
Initial download of the metrics may take a while.