Fig. 1.
Download original image
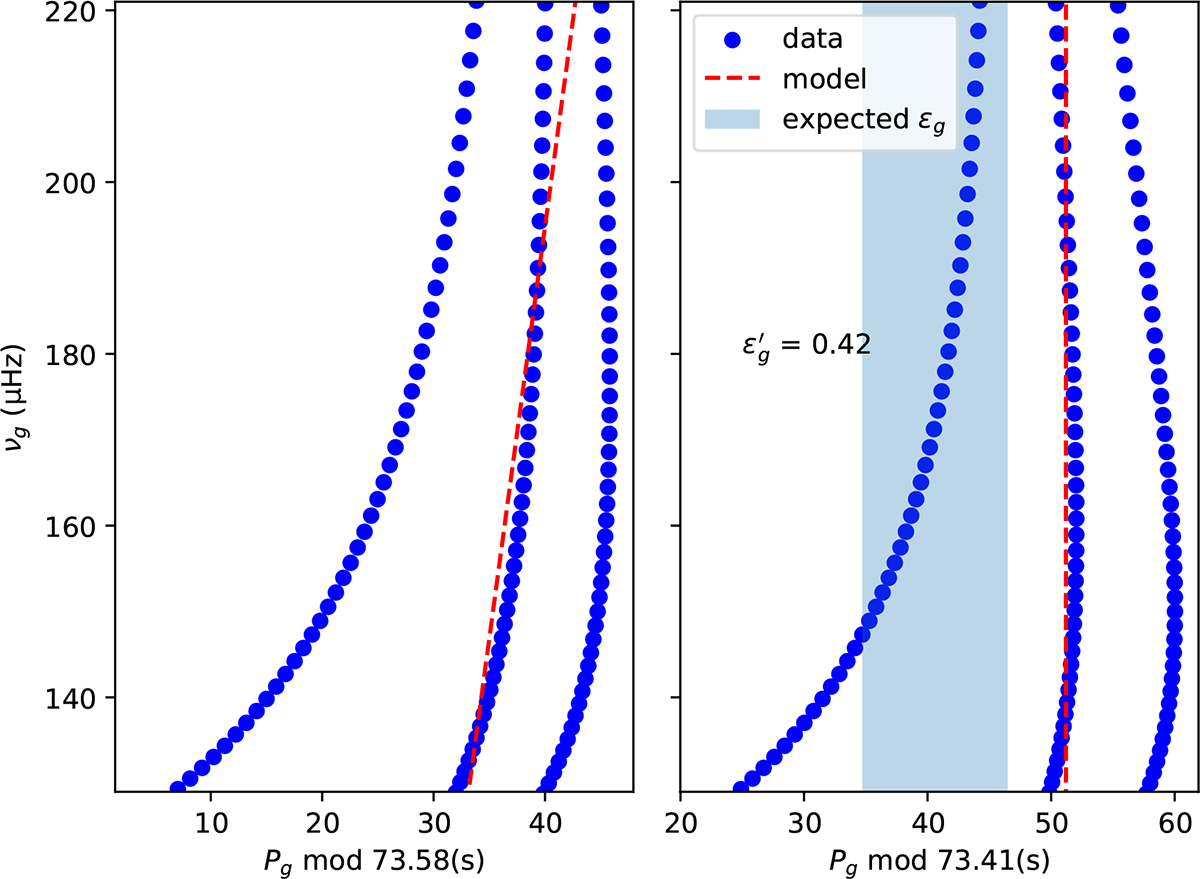
Échelle diagrams of mock g-mode spectra perturbed by rotation and magnetic field. Left: Spectrum fitted with an asymptotic expression accounting for magnetic and rotational perturbations, folded by the true ΔΠ1. Right: Spectrum fitted with an asymptotic expression for rotation only, folded by the measured ΔΠ1′. The red lines represent the slope of the m = 0 component, which is purely vertical on the right. The blue area represents the area where m = 0 modes are expected to be found using ϵg = 0.28 ± 0.08.
Current usage metrics show cumulative count of Article Views (full-text article views including HTML views, PDF and ePub downloads, according to the available data) and Abstracts Views on Vision4Press platform.
Data correspond to usage on the plateform after 2015. The current usage metrics is available 48-96 hours after online publication and is updated daily on week days.
Initial download of the metrics may take a while.