Fig. 11.
Download original image
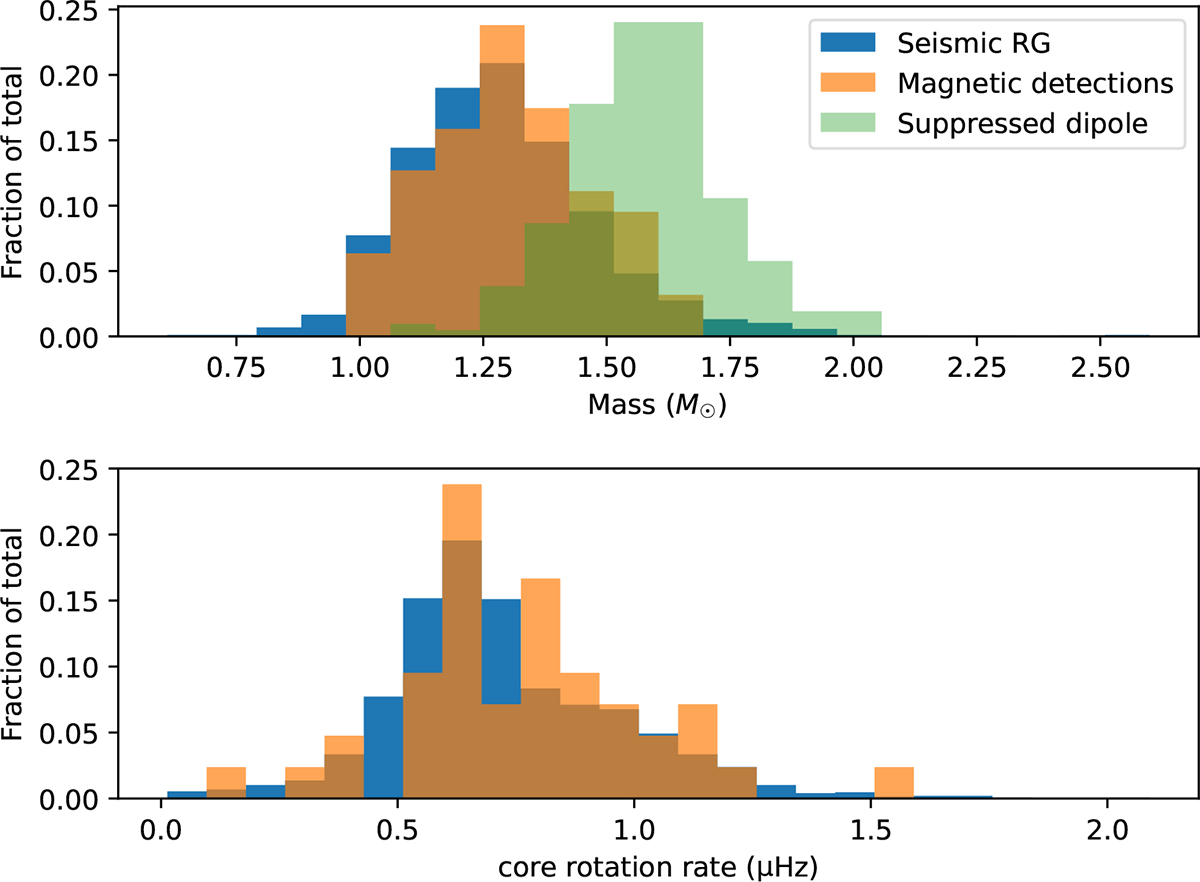
Top: Normalised histogram of stellar mass comprised of data from Hatt et al. (2024), Li et al. (2024), Deheuvels et al. (2023), and this study. The distribution for magnetic detections is shown in orange, and the entire distribution of red giants is represented in blue. The distribution for dipole depressed modes in Stello et al. (2016) is shown on green. Bottom: Normalised histograms of the core rotation rate νR, g comprised of data from the same previous studies. The colours are the same as above.
Current usage metrics show cumulative count of Article Views (full-text article views including HTML views, PDF and ePub downloads, according to the available data) and Abstracts Views on Vision4Press platform.
Data correspond to usage on the plateform after 2015. The current usage metrics is available 48-96 hours after online publication and is updated daily on week days.
Initial download of the metrics may take a while.