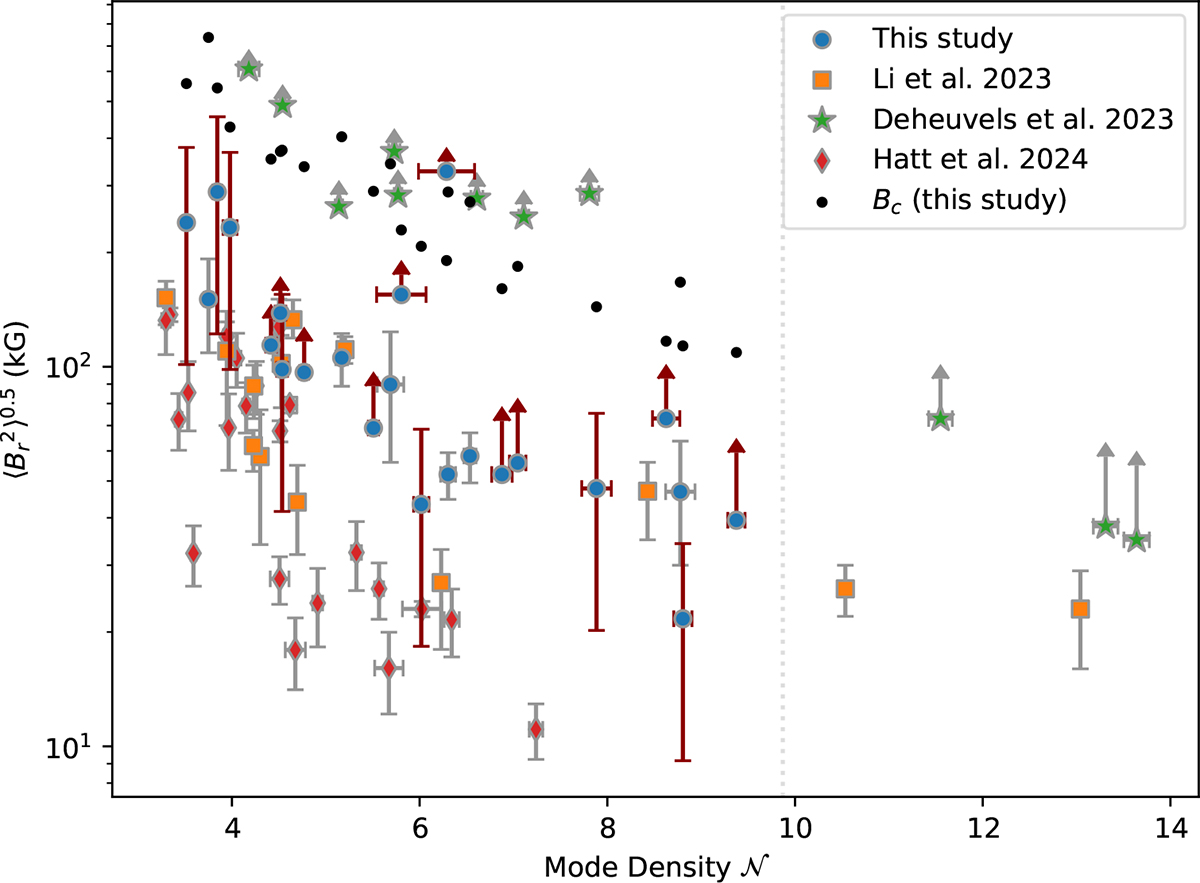
Fig. 12.
Download original image
Variation of magnetic field intensity with mode density, used as a proxy for stellar evolution. Four different studies are represented in the plot. The arrows pointing upwards represent lower limits to the field intensity while red, while vertical error bars represent the lower and upper limits of the magnetic fields for stars that only show two l = 1 mode components. The grey dotted line at 𝒩 = 9.87 represents the upper limit in evolution reachable in this study (calculated using Δν = 10 μHz and the relevant values for ΔΠ1 and νmax obtained from the degeneracy sequence and seismic scaling laws).
Current usage metrics show cumulative count of Article Views (full-text article views including HTML views, PDF and ePub downloads, according to the available data) and Abstracts Views on Vision4Press platform.
Data correspond to usage on the plateform after 2015. The current usage metrics is available 48-96 hours after online publication and is updated daily on week days.
Initial download of the metrics may take a while.