Fig. A.1.
Download original image
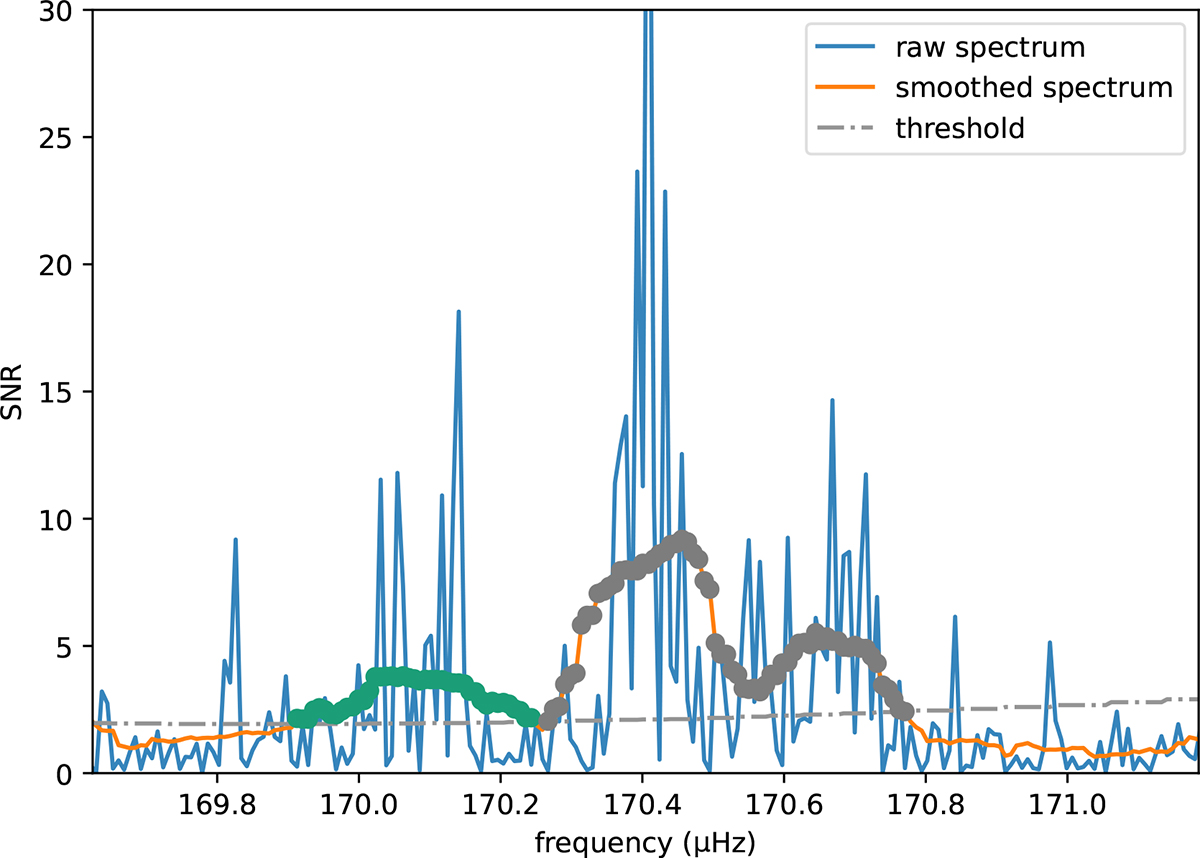
Portion of the PSD of KIC 4660930 showing a mixed l = 1 mode. The raw spectrum is plotted in blue, the variable smoothed spectrum is plotted in orange, and the dash-dot grey line represents the significance threshold of the smoothed spectrum. The dot markers represent the points of the spectrum that exceed the threshold, and the colours represent the group to which they belong.
Current usage metrics show cumulative count of Article Views (full-text article views including HTML views, PDF and ePub downloads, according to the available data) and Abstracts Views on Vision4Press platform.
Data correspond to usage on the plateform after 2015. The current usage metrics is available 48-96 hours after online publication and is updated daily on week days.
Initial download of the metrics may take a while.