Open Access
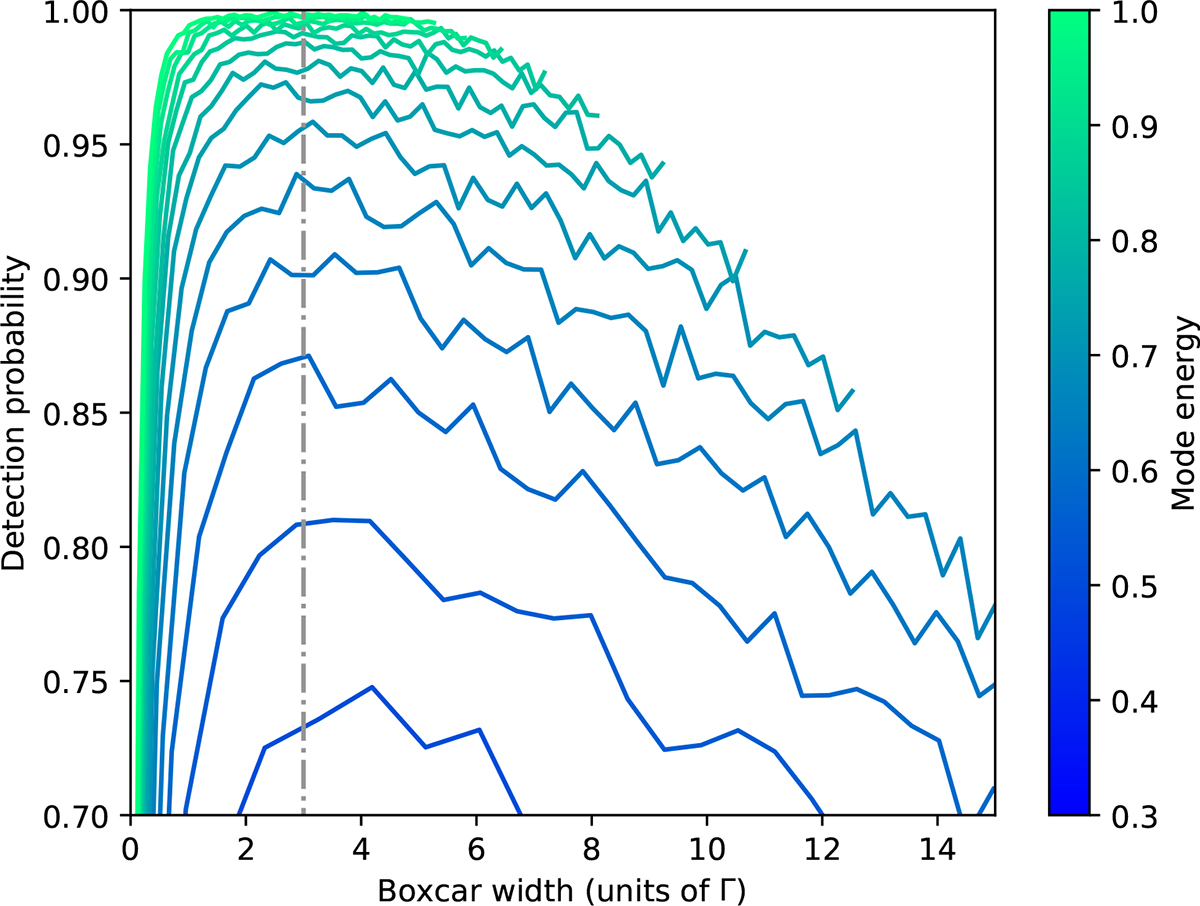
Fig. 3.
Download original image
Probability of detection of a mode versus the boxcar width, in units of the mode width. The colour of the lines indicates the mode energy, defined as E ∝ Γh, where Γ is the mode width and h is mode height. The vertical dash-dotted line corresponds to a boxcar width of 3Γ.
Current usage metrics show cumulative count of Article Views (full-text article views including HTML views, PDF and ePub downloads, according to the available data) and Abstracts Views on Vision4Press platform.
Data correspond to usage on the plateform after 2015. The current usage metrics is available 48-96 hours after online publication and is updated daily on week days.
Initial download of the metrics may take a while.