Open Access
Fig. 6.
Download original image
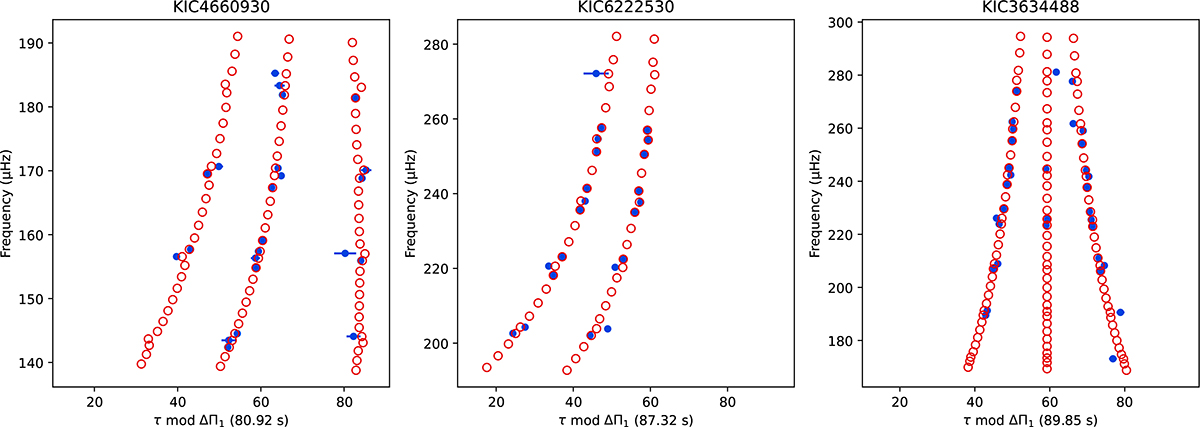
Stretched échelle diagrams of KIC 4660930, KIC 6222530, and KIC 3634488. Blue dots represent detected frequency, and red circles represent the maximum a posterior model of the determination.
Current usage metrics show cumulative count of Article Views (full-text article views including HTML views, PDF and ePub downloads, according to the available data) and Abstracts Views on Vision4Press platform.
Data correspond to usage on the plateform after 2015. The current usage metrics is available 48-96 hours after online publication and is updated daily on week days.
Initial download of the metrics may take a while.