Open Access
Fig. 9.
Download original image
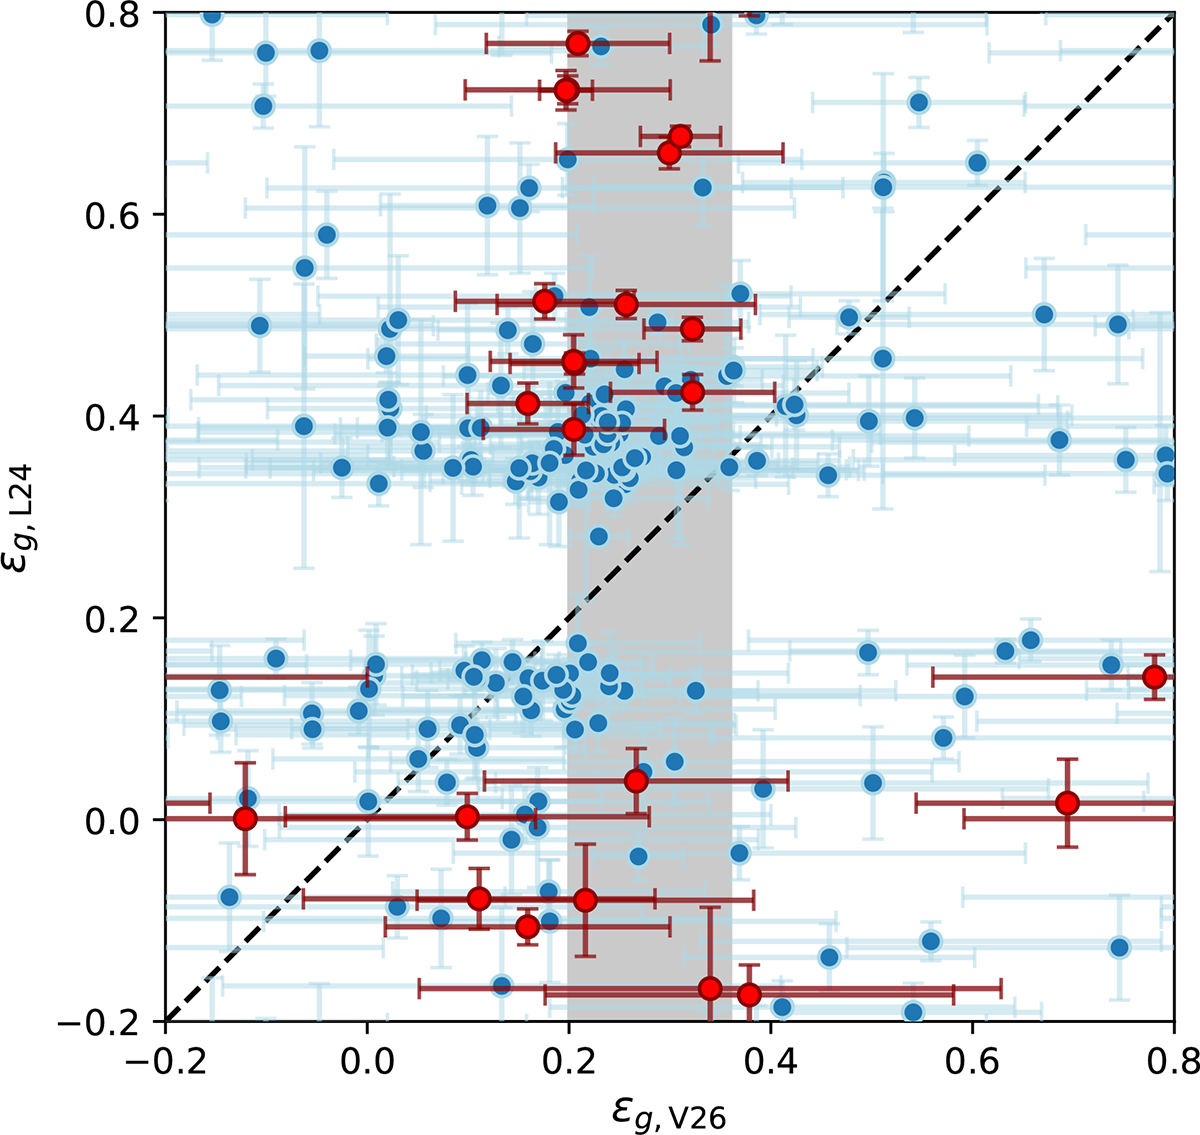
Comparison of ϵg between Li et al. (2024) and this study. Blue dots represent stars with no detected magnetic field and red dots represent stars with magnetic detections. The grey-shaded area represents the empirical value of ϵg at 0.28 ± 0.08 (Mosser et al. 2015). The dashed black line represents the 1:1 line.
Current usage metrics show cumulative count of Article Views (full-text article views including HTML views, PDF and ePub downloads, according to the available data) and Abstracts Views on Vision4Press platform.
Data correspond to usage on the plateform after 2015. The current usage metrics is available 48-96 hours after online publication and is updated daily on week days.
Initial download of the metrics may take a while.