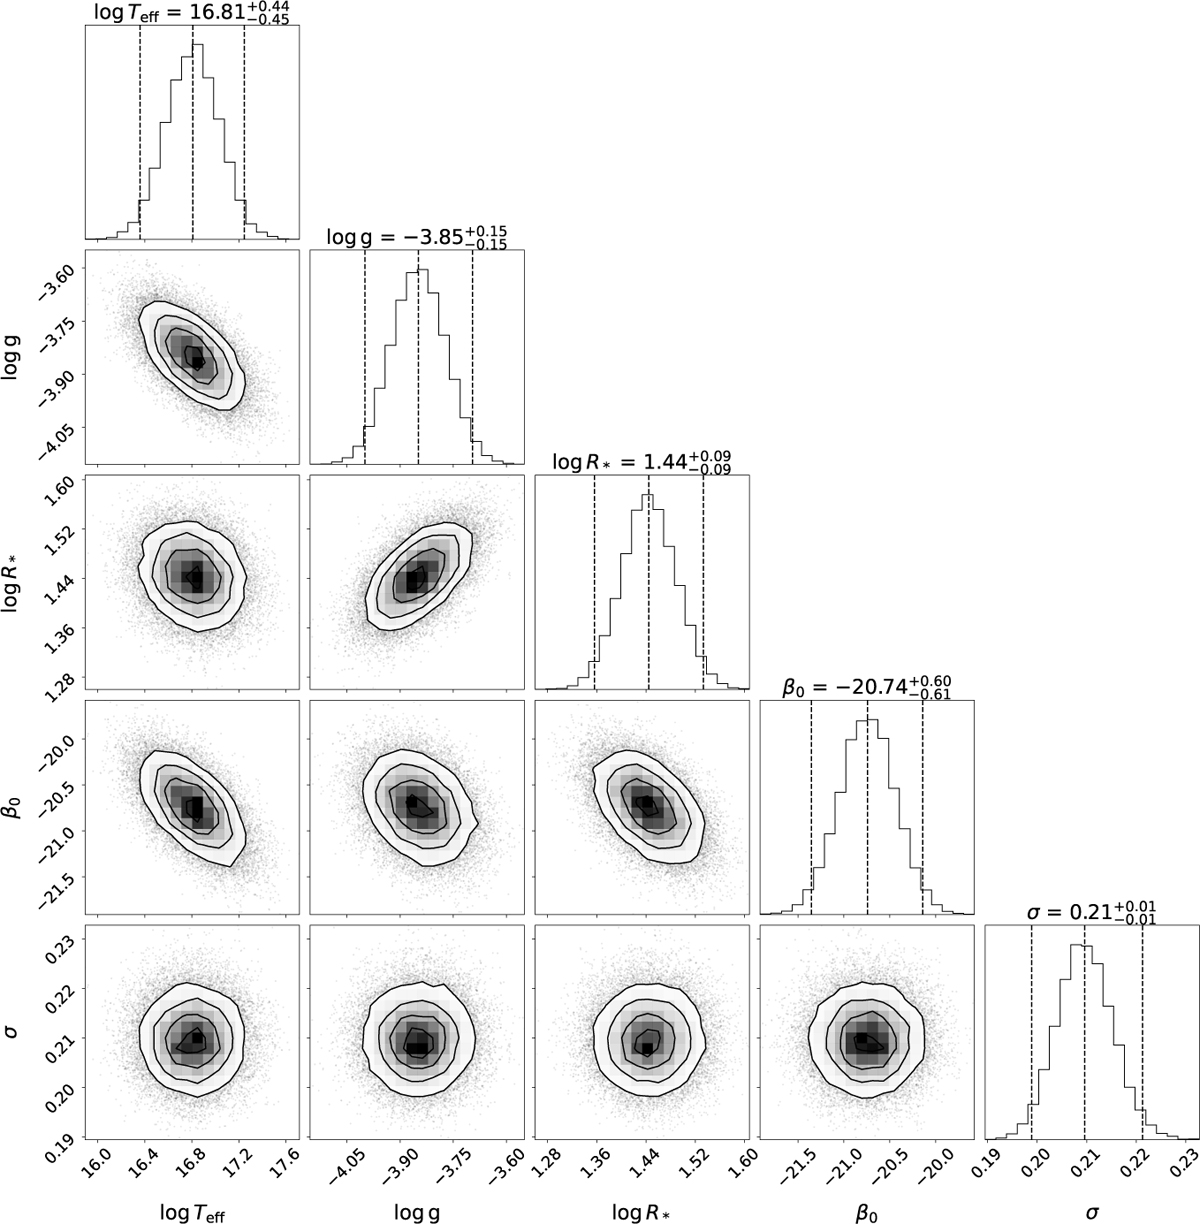
Fig. A.3
Download original image
Corner plot showing the results of the Bayesian linear regression performed for the mass-loss rates ( Ṁ) in the CNO grid. As observed, the correlations remain low, except for the same parameters previously mentioned. However, the dispersion continues to follow the decreasing trend, maintaining a high R2. This indicates the model performs well in describing the results obtained with our procedure, suggesting it is effective in capturing the relationships between stellar parameters and mass-loss rates.
Current usage metrics show cumulative count of Article Views (full-text article views including HTML views, PDF and ePub downloads, according to the available data) and Abstracts Views on Vision4Press platform.
Data correspond to usage on the plateform after 2015. The current usage metrics is available 48-96 hours after online publication and is updated daily on week days.
Initial download of the metrics may take a while.