Fig. 10
Download original image
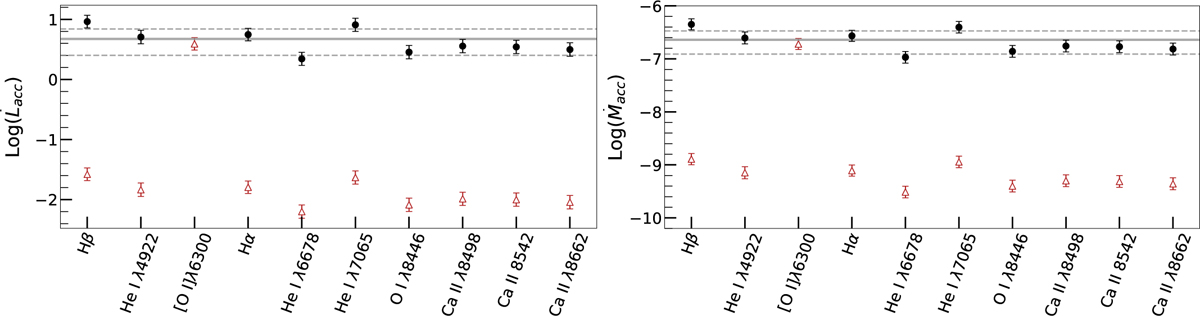
Estimated values of Lacc (left) and Ṁacc (right), taking AV = 1.26 mag. Values are shown before (red) and after (black) correction for the estimated obscuration factor. In each plot, the third data point shows the value derived from the [O I]λ6300 line, which is used to estimate the correction for obscuration. The solid horizontal line shows the mean of the corrected values, with the 1-σ bounds shown by dashed lines.
Current usage metrics show cumulative count of Article Views (full-text article views including HTML views, PDF and ePub downloads, according to the available data) and Abstracts Views on Vision4Press platform.
Data correspond to usage on the plateform after 2015. The current usage metrics is available 48-96 hours after online publication and is updated daily on week days.
Initial download of the metrics may take a while.