Fig. A.2
Download original image
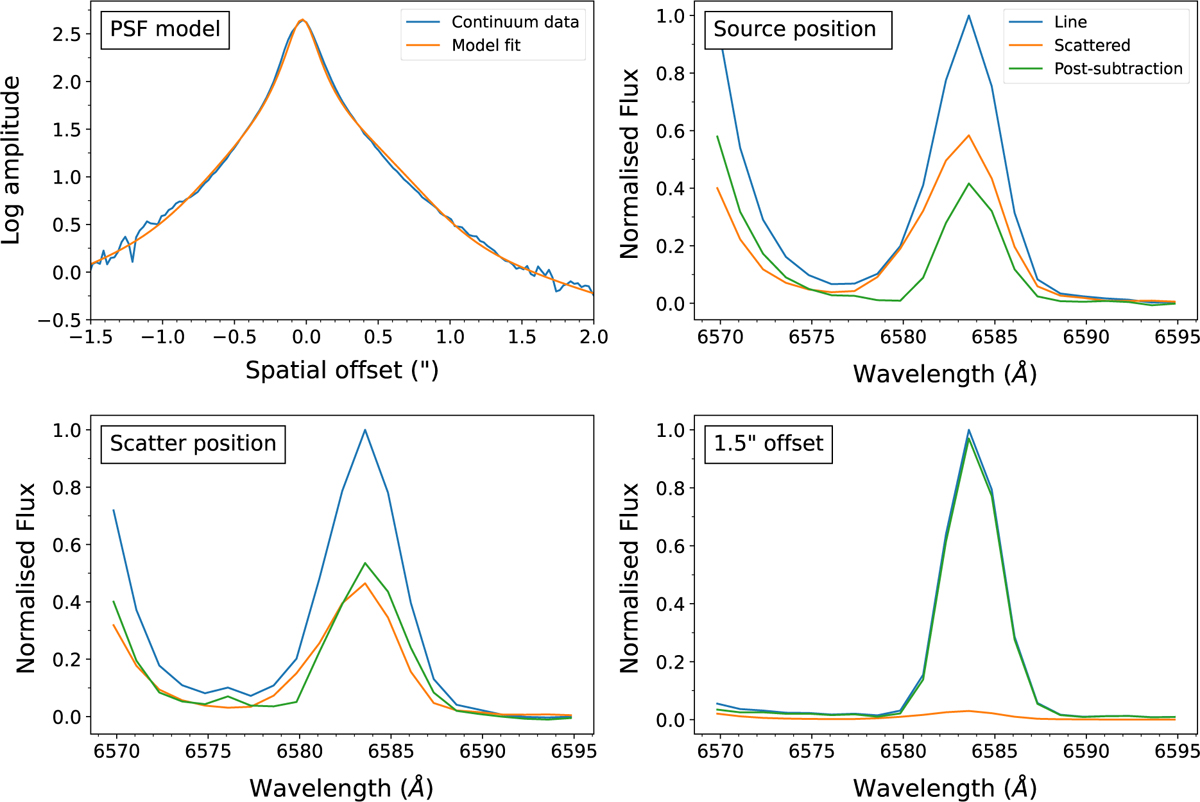
Scattered emission subtraction report for the [N II]λ6583 line. Top left: Cross-section of the fitted continuum model used to scale the subtracted spectrum, extracted parallel to the jet axis. The remaining panels show the line emission before and after subtraction of the scaled reflected spectrum, at the source position (top right), at one of the positions where the scattered emission is measured (bottom left), and at an off-source jet position (bottom right).
Current usage metrics show cumulative count of Article Views (full-text article views including HTML views, PDF and ePub downloads, according to the available data) and Abstracts Views on Vision4Press platform.
Data correspond to usage on the plateform after 2015. The current usage metrics is available 48-96 hours after online publication and is updated daily on week days.
Initial download of the metrics may take a while.