Fig. C.2
Download original image
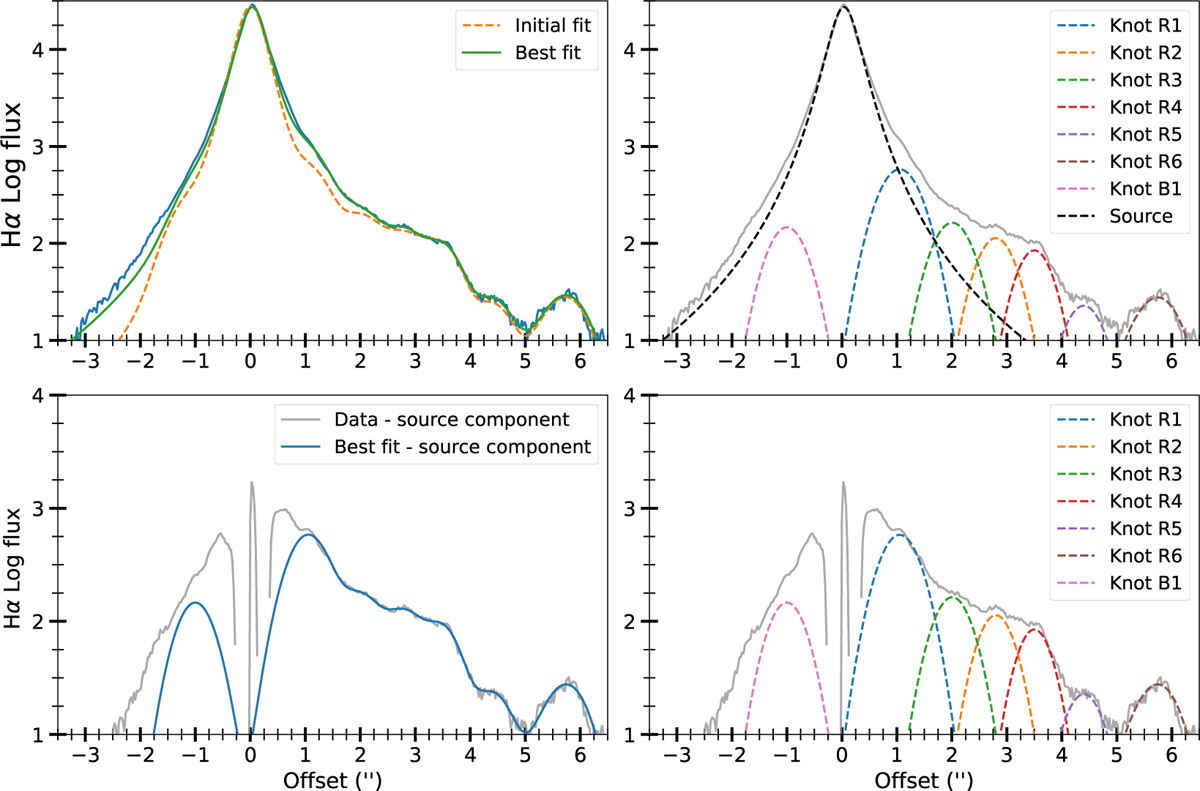
Model fitting to the Hα jet flux profile (grey) without scattered emission subtraction. The source peak is fitted with a Moffat function and knot peaks are fitted with Gaussian profiles. Top left: Initial and best-fit models compared with the data. Top right: Components of the best-fit model. Lower left: Comparison of the best fit model and data after the fitted source peak is subtracted, highlighting the model residuals. Lower right: Data after the source peak is subtracted, overlaid with the remaining model components (the knot peaks).
Current usage metrics show cumulative count of Article Views (full-text article views including HTML views, PDF and ePub downloads, according to the available data) and Abstracts Views on Vision4Press platform.
Data correspond to usage on the plateform after 2015. The current usage metrics is available 48-96 hours after online publication and is updated daily on week days.
Initial download of the metrics may take a while.